GI.bench has replaced test.commander as the software for DAQ system configuration and visualization. Only Q.station and Q.monixx controllers are compatible with GI.bench. Older controllers (e.g. Q.gate, Q.pac, e.series, etc) must still use test.commander. A system with a Q.station connected to e.bloxx modules must use test.commander as well.
Table of Contents
- Introduction
- Installation
- Starting test.commander
- Licensed Version
- Creating a New Project
- Scanning for Controllers
- Updating Firmware
- Configure Slave Addresses
- Adding Controllers to a Project
- Configuring a Controller
- Resetting or Reconfiguring a Controller
- Naming Variables
- Organizing the Project Workspace
- Adjusting Variables using Online Values
- Read Controller’s Buffer
- Read Online Values from Controller
- Read Slave Information Online
- Read Controller Information Online
- Offline Mode
- Project Statistics
- Exporting Projects
Introduction
The software tool test.commander is used to configure a complete Gantner system. This guide will describe the different features and capabilities of test.commander and how it is best utilized.
Purpose
Any Gantner system that utilizes a Gantner controller (i.e., Q.gate, Q.pac, or Q.station) uses test.commander for configuration. This includes but is not limited to sample rate settings, synchronization, interfaces, calculations, data logging, and channel configuration. Every copy of test.commander includes ICP100 and test.viewer. ICP100 is the channel configuration tool of measurement modules and test.viewer is the data visualization and analysis tool of acquired data.
Downloads
The latest and greatest version of test.commander can be downloaded directly from the Gantner Instruments website:
https://gi-productbase.gantner-instruments.com/en/rest_api/downloads/public/46/
The newest version of test.commander contains the most up-to-date versions of the controller and measurement module firmware. A new installation of test.commander on a new PC will be installed in DEMO mode. To configure a complete system, a LICENSED version of test.commander is required. Inquire with your local Gantner Instruments vendor on how to obtain a license for test.commander.
Recommended PC Requirements
- Windows XP
- 4 GB RAM
- Dual Core Processor (2+ GHz)
- Ethernet Port
- USB Port
- Data Storage (depends on application)
Installation
- Download the most recent version of test.commander from the Gantner Instruments website.
- Unzip the contents of the ZIP file.
- The Setup.exe file will be found in the unzipped folder. Double-click on this file to start the installation process.
- After the installation process has been completed, double-click the test.commander icon.

- Before connecting Gantner hardware to test.commander, make sure to configure the correct IP address settings of the PC and provide the proper exceptions in the firewall for Gantner software tools.
Starting test.commander
- The first thing to make sure test.commander is useable is to change the language settings. The software can be used in one of the following modes:
- English
- French
- German
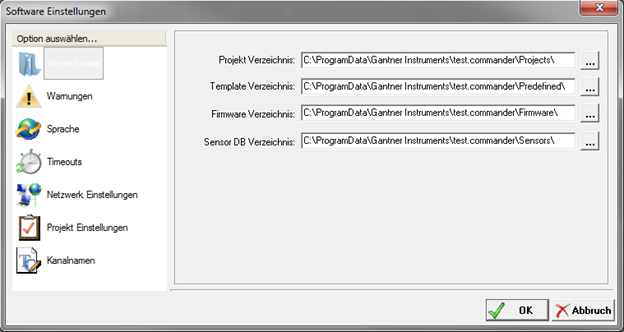
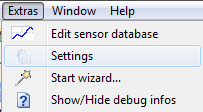
- If test.commander starts in German, navigate to the following location:
Extras > Einstellungen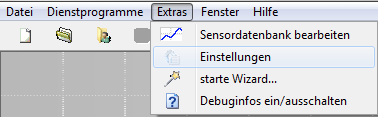
- Navigate to Sprache.
- Select English.
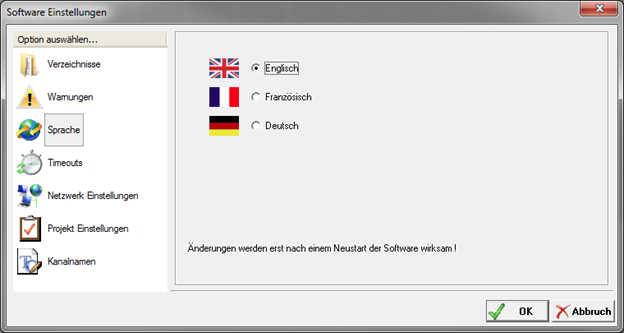
- Click the OK button to save the new setting. Restart test.commander.
Licensed Version
- Start test.commander.
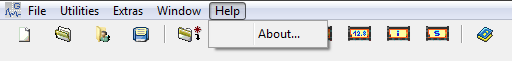
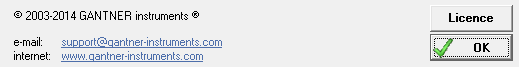
- Select Help > About.
- Select the License button.
- Enter the license information exactly as obtained from your Gantner vendor.
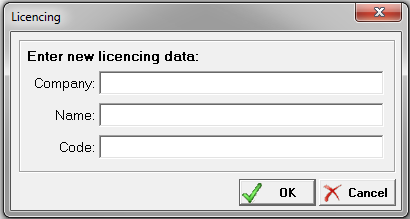
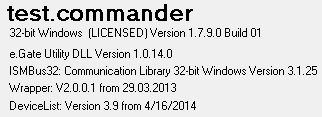
- After the information is entered correctly, the LICENSED version will be displayed.
Creating a New Project
- When test.commander opens, a window displays several projects starting options.
We recommend choosing either Open new project or Open existing project (if one has been previously created).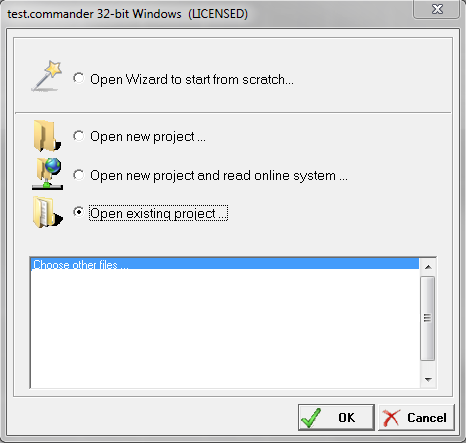
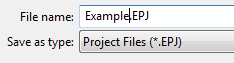
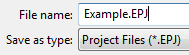
- For this guide, we will create a new project; therefore give the new project a name. The project files will be saved in the default location of the Gantner Instruments directory.
- A blank test.commander project is ready to be used.
Scanning for Controllers
- Controllers shipped from the factory have a default static IP address of 192.168.1.28. While this configuration will work for some networks, the static IP address of the controller might need to be modified for others.
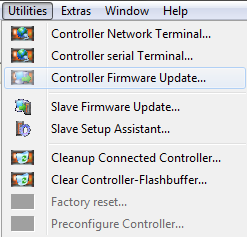
- Select Utilities > Controller Network Terminal.
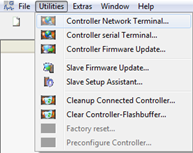
- The Network Finder window will open and show all controllers connected to the PC, even on a different subnetwork. The IP, Subnet, and Gateway of the controller are displayed.
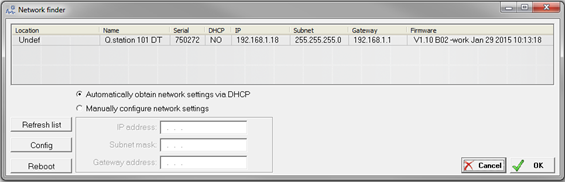
- If the default settings of the controller are sufficient, close the Network Finder window. To modify a controller’s IP address, highlight the controller to configure.
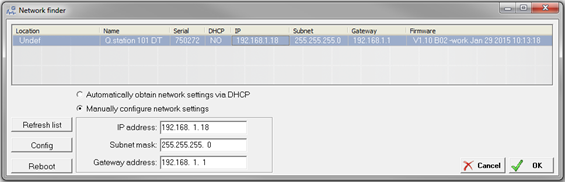
- The controller’s IP address, Subnet mask, and Gateway address are placed into the appropriate cells. Manually enter or modify these settings here. Click the Config button to apply the new settings.
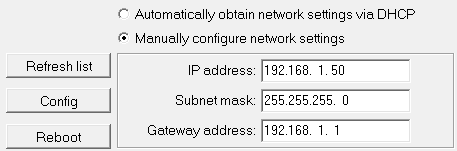
- The controller will restart after the changes have been made. Click on the Refresh list button to view the updated settings.
Updating Firmware
Controller
- Ensure the most updated version of test.commander is installed, or the firmware to update to is on the same PC. Note: any test.con project loaded on control is erased during a firmware update.
- Select Utilities > Controller Firmware Update.
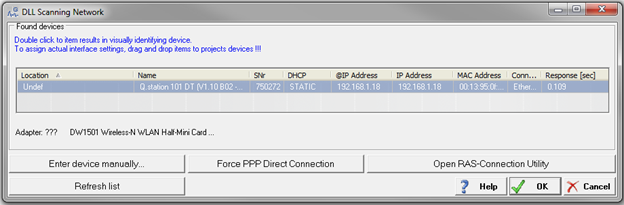
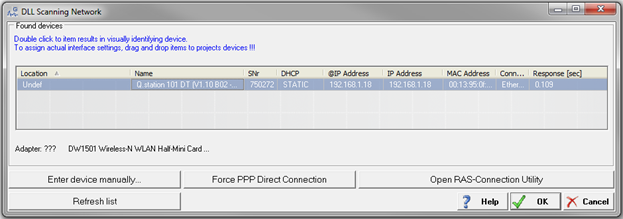
- The DLL Scanning Network window will scan for and display all connected controllers. Highlight the controller to update and click the OK button.
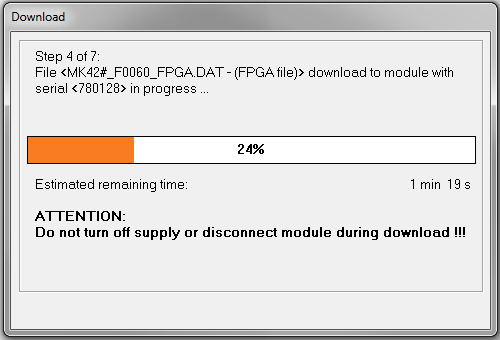
- IMPORTANT: Do not disconnect power or communications to the controller during the update process.
- The controller will restart automatically at the end of the update process.
Slave Modules
- Similarly, ensure the most updated version of test.commander is installed to ensure the most up-to-date version of the firmware is loaded on the PC.
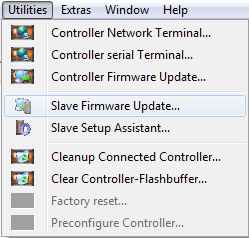
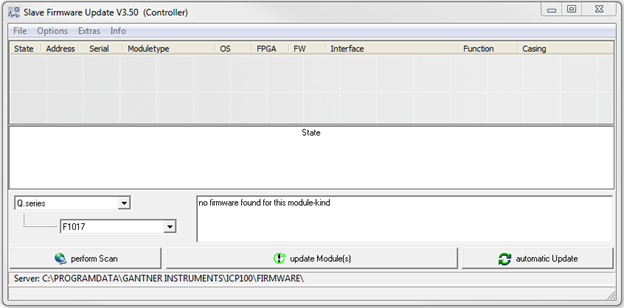
- Select Utilities > Slave Firmware Update.
- The Slave Firmware Update window will appear. Click on the Perform Scan button.
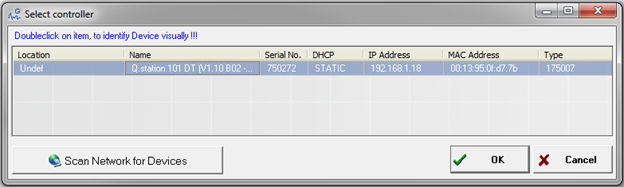
- Highlight the controller to scan and click on the OK button.
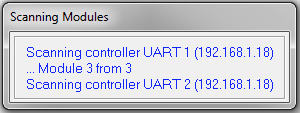
- The software will scan all available UARTs to find all connected slave modules.
- The software will compare the firmware version currently loaded on the module vs. the firmware version available on the PC. If the module has the most updated version, a green check mark will be displayed next to that module. A red X will be displayed next to a module with an older firmware version.
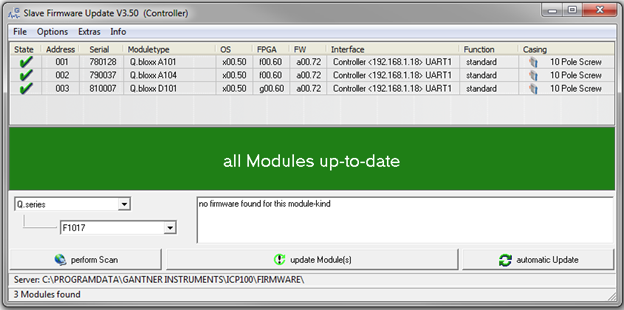
- If any modules are not updated, a red bar will be displayed instead of a green bar. Highlight the modules that require an update and select the update Module(s) button to apply these updates. The firmware files will be downloaded to the module.
Configure Slave Addresses
- Every slave module on a specific UART needs to have a unique address. The first module should have an address of 1.
- Select Utilities > Slave Setup Assistant.
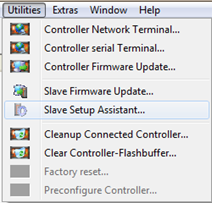
- The Slave Setup Assistant window appears. Select the Perform Scan button.
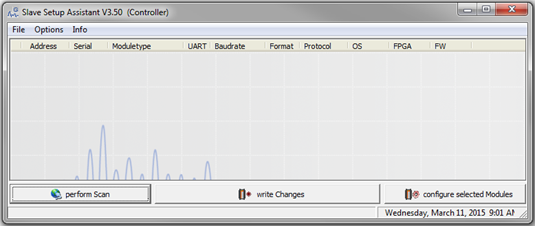
- Another window appears with the list of all connected controllers. Highlight the controller where the slave modules are connected and click OK.

- All modules connected to the specified controller will be displayed.
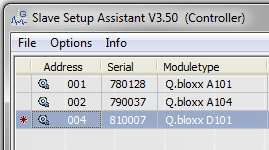
- Use the Address column to modify the address of the module.
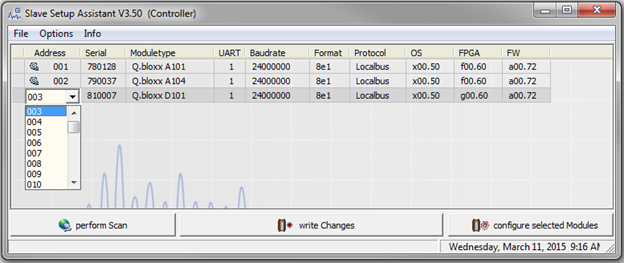
- Modules that have an address to be updated will have a red star in the first column.
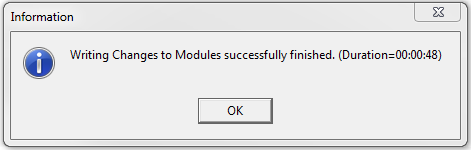
- Select the write Changes to apply the new addresses.
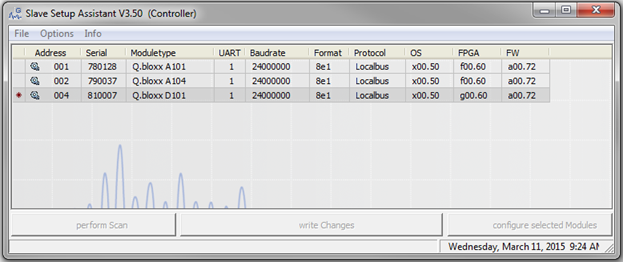
- The software will re-scan the controller and confirm the process.
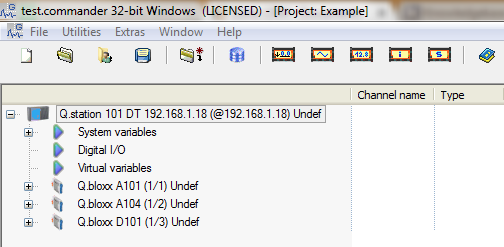
Adding Controllers to a Project
- The controller can be connected after updating the firmware of all modules (controller and slaves), configuring IP settings & PC firewall, and configuring node addresses.
- Right-click anywhere in the project workspace to access the add controller options.
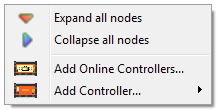
- Select Add Online Controllers. The software will scan and display all connected controllers. Highlight the controller to add to the project and select the OK button.
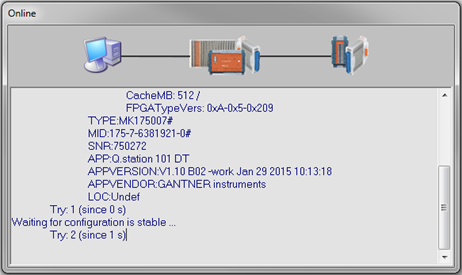
- The software will read the configuration files inside the hardware.
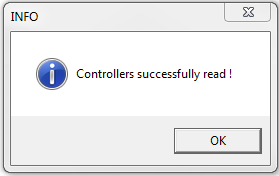
- The following window will appear when the process is complete.
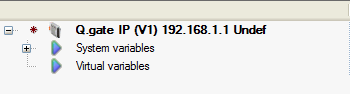
- The controller and all connected slave modules will be displayed in the project workspace.
Configuring a Controller
- Double-click on the controller to access the settings menu.
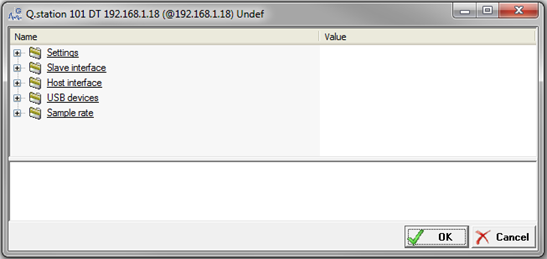
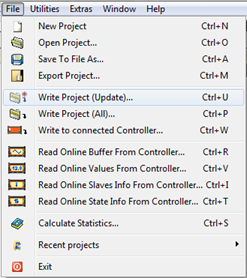
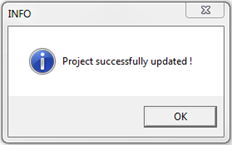
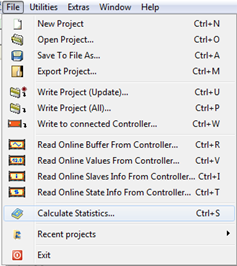
- If any settings have been modified on the controller or channel configuration of the slave modules, these settings need to be updated to the hardware. Select File > Write Project (Update).
- The system will write the updated project files to the controller.
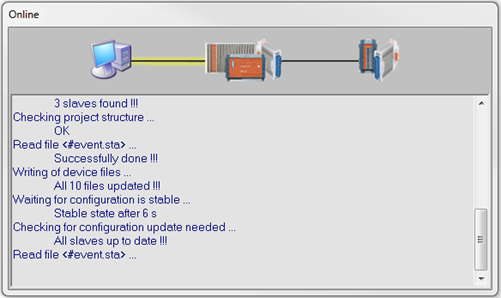
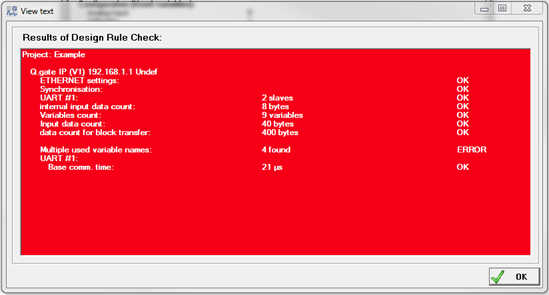
- Upon successful completion:
- There are instances when test.commander will not update the project to the hardware. A red (unacceptable) or yellow (possible) screen will be displayed.
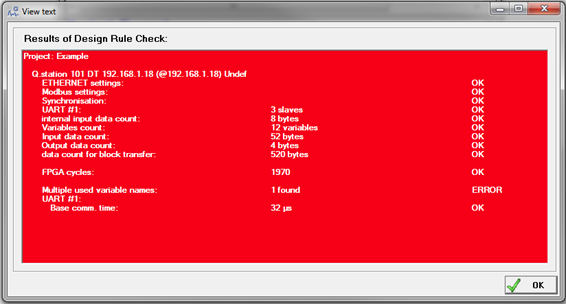
- The type of error will be displayed on the design rule check screen. The source of the error can be caused by several reasons, including:
- All variables do not have a unique name
- Too many variables on a single UART
- UART baud rate is either too fast or too slow
- The controller’s update rate is too fast
- The slave address configuration is incorrect
- Incorrect interface settings (i.e., EtherCAT, CAN, etc.)
- Incorrect data logger configuration
- Modify the settings before attempting to update the project again.
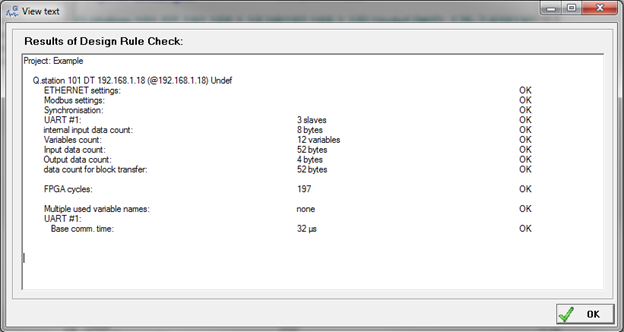
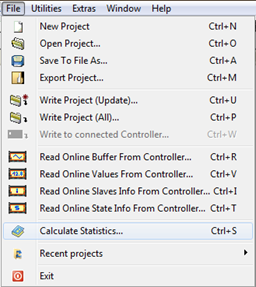
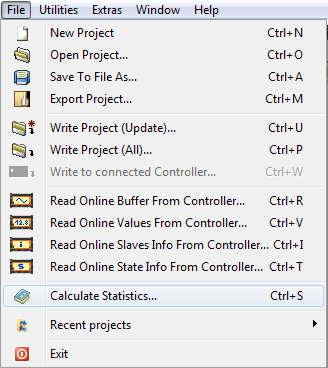
- To check the project's validity before attempting to update the hardware, select File > Calculate Statistics. Then select the Check button at the bottom of the Statistics page.
- The project is ready to be updated if a white screen is displayed.
Resetting or Reconfiguring a Controller
- In the situation where the configuration of a controller needs to be overhauled, the controller can be reset or cleaned. Resetting a controller applies the original factory settings. Cleaning the controller maintains the current controller settings but erases the slave module configuration.
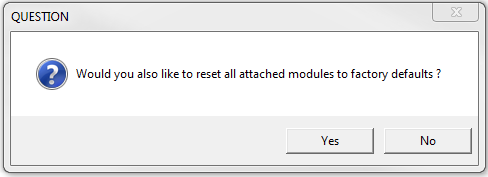
- To reset a controller, it must first be read by test.commander. With the controller open in test.commander, highlight it, and select Utilities > Factory reset.
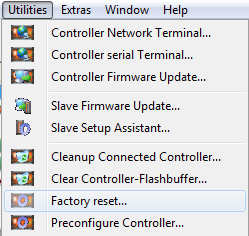
- Click Yes to confirm the process.
- Cleaning the controller to remove the slave configuration files is useful when the slave modules need to be rearranged or swapped.
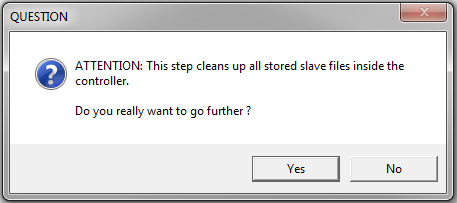
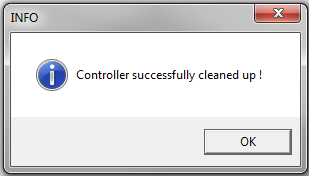
- With the controller connected to test.commander, select Utilities > Cleanup Connected Controller.
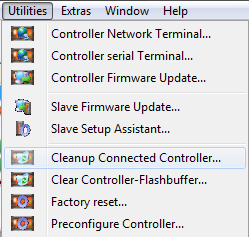
- Click Yes to confirm the process.
- The following window will appear after the process.
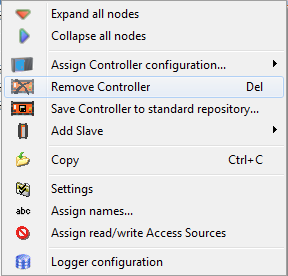
- Right-click on the controller in test.commander and select Remove Controller to erase the configuration from the current project.
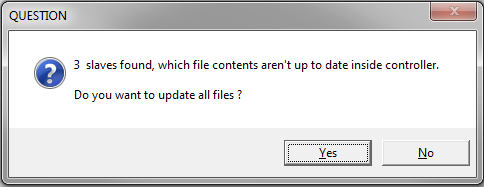
- The controller can be added to the project after reassembling/rearranging the hardware, performing the necessary firmware, and addressing settings.
- Since the controller was cleaned of any slave configuration files, test.commander will ask if you want to update the controller with the new configuration. Click Yes to proceed.
Naming Variables
- As mentioned in a previous section, all variables within a single controller need to have unique names. This can be performed one by one for each variable or in batches.
- Before naming the variables in batches, let’s create some rules for certain groups of variables. Select Extras > Settings.
- Within the software settings window, select the Var-names option.
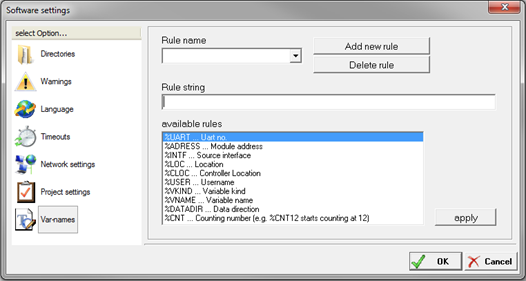
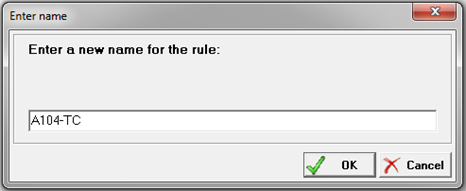
- Select the Add new rule button. Give the rule a name and click OK.
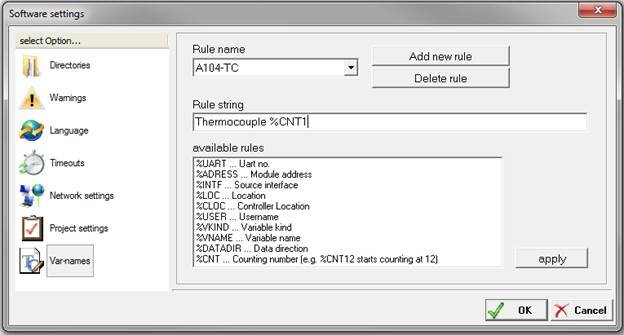
- Create a custom rule string in the cell provided using the available rules. Click the OK button to save. Previously created rules can also be deleted; select the rule from the drop-down menu and click the Delete rule button.
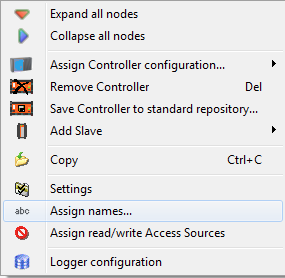
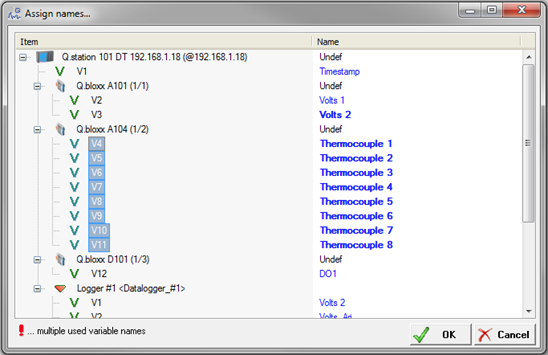
- Back in the main project workspace, right-click on the controller and select Assign Names.
- The assign names window will open, displaying all the configured variables within the controller. If any variables have the same name, a red exclamation mark will be shown next to those variables.
All unique variable names: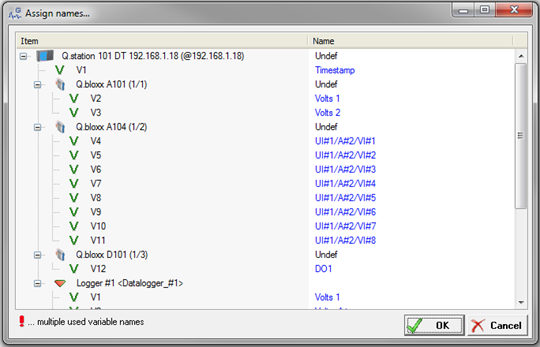
Variables with the same name:
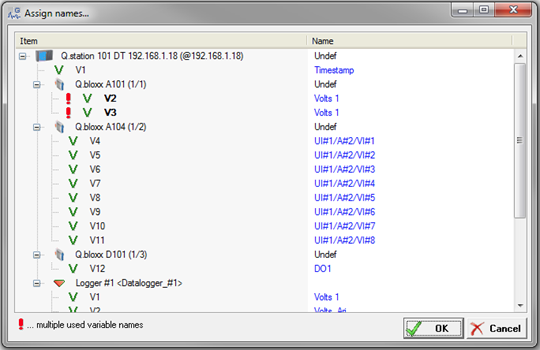
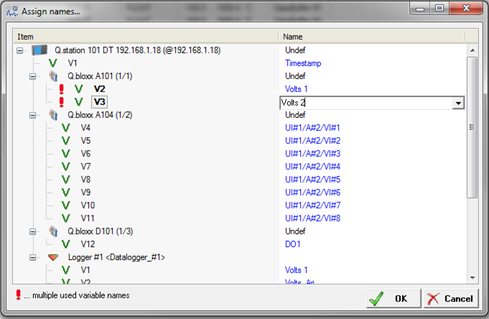
- Variables can be named one by one here.
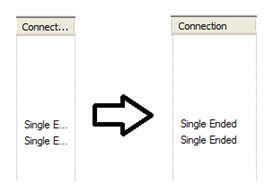
- The more efficient method is to highlight a group of variables and perform a batch rename. After highlighting the variables, perform a right-click and select the naming scheme/rule to use.
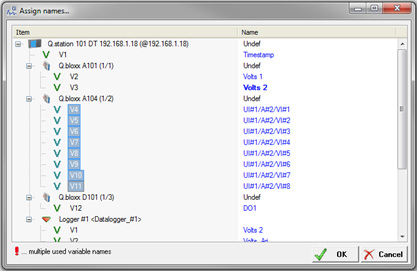

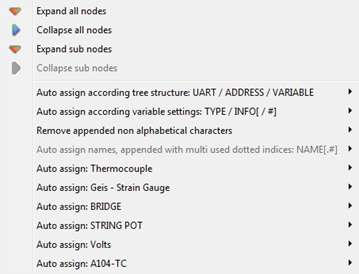
- There are some predefined schemes to use:
- Assign according to tree structure
- Assign according to variable settings
- One of the previously created rules can also be used. Click the OK button to confirm the changes.
- Make sure to update the project settings to the controller.
Organizing the Project Workspace
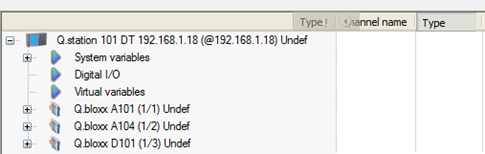
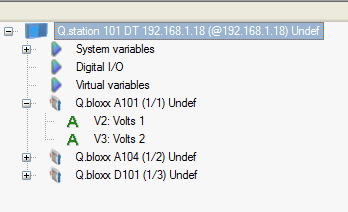
- After connecting to the controller, the individual modules will be displayed under the controller. The various specifications of the modules can be displayed in the workspace.
- Right-click in the header of the workspace to open the specification selection column.
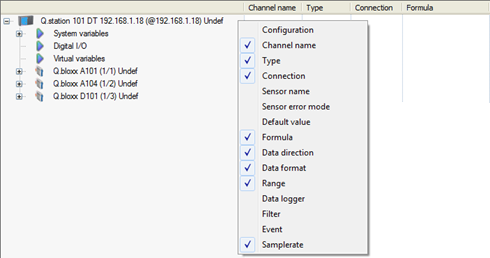
- The columns can be organized by dragging the columns to the desired locations.
- The columns can be resized by dragging the columns left and right.
Adjusting Variables Using Online Values
- Performing a point-to-point calibration of any channel using live values is possible. Make sure to perform any conversion to engineering units in ICP100 first.
- Highlight the connected controller.
- Select the Adjust Online values from Controller.
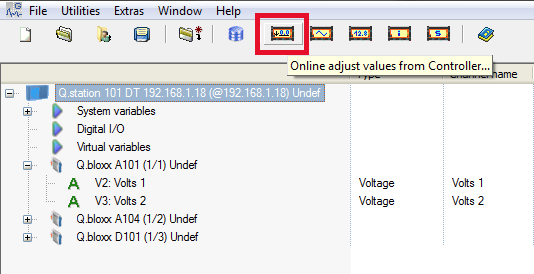
- The system will scan and connect to the highlighted controller.
- The Adjustment window will appear.
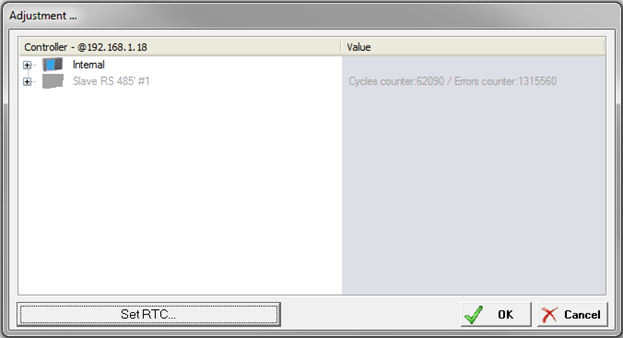
- Open the available UARTs (i.e., Slave RS 485 #1 shown below).
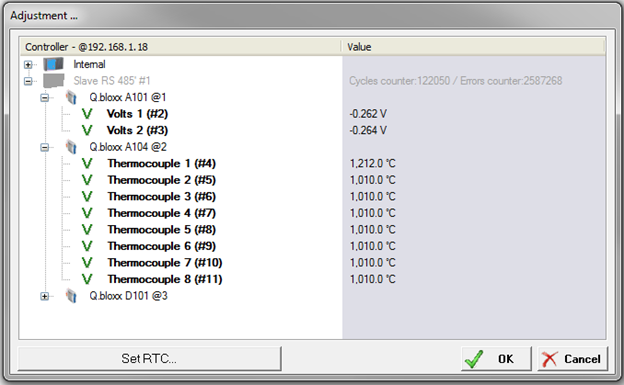
- The individual modules are shown, and the channels inside each of those modules.
- Click on the variable to calibrate. Select the Adjustment button.
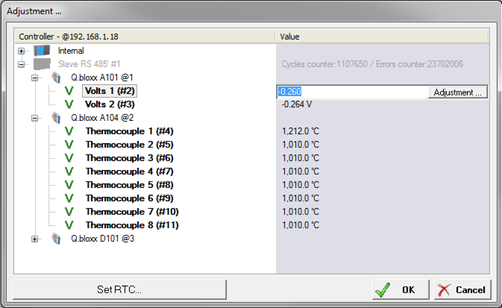
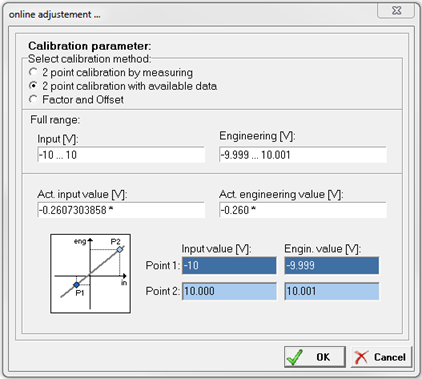
- The online adjustment window will appear. Use one of the three available options to perform the calibration. Click the OK button to confirm. Repeat the process for all desired variables.
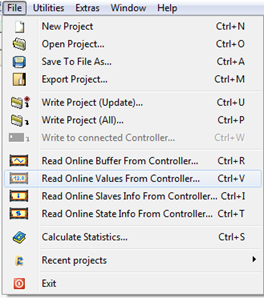
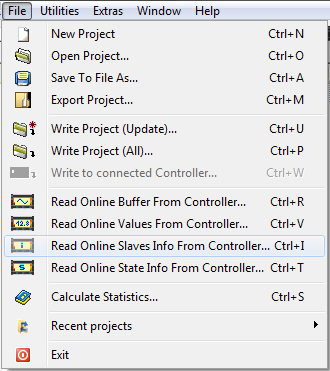
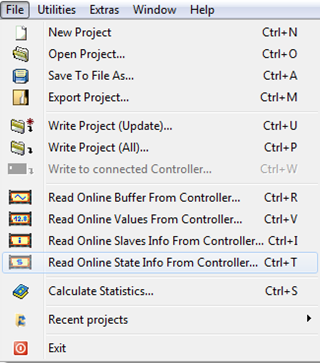
Read Controller’s Buffer
- The Gantner controller has configurable circular buffers, sometimes more than one (4 available in a single Q.station).
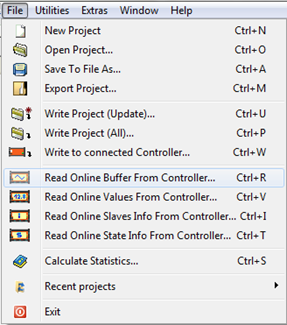
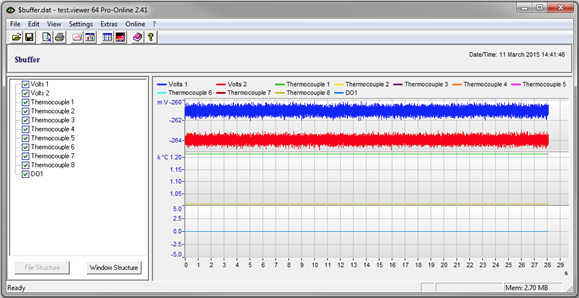
- The current data in these circular buffers can be read and displayed in test.viewer. Select File > Read Online Buffer From Controller.
- The software will read the data files in the buffer.
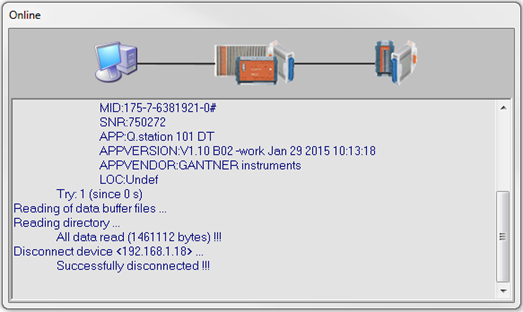
- The data will open in test.viewer for further data analysis.
Read Online Values from Controller
- It is possible to view live values within test.commander. This live data can also be viewed within test.viewer.
- Select File > Read Online Values From Controller.
- The View Values window will appear. This window displays live values from all channels.
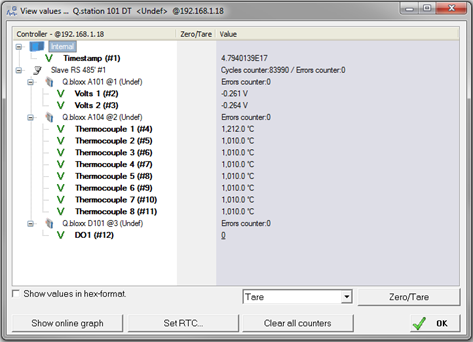
- Zero and Tare of channels (if previously configured) can be performed here. A check mark can be placed within the Zero/Tare column next to the channels to calibrate. Select the option from the drop-down menu and press the Zero/Tare column.
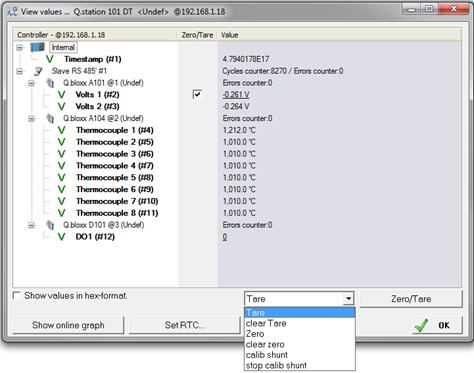
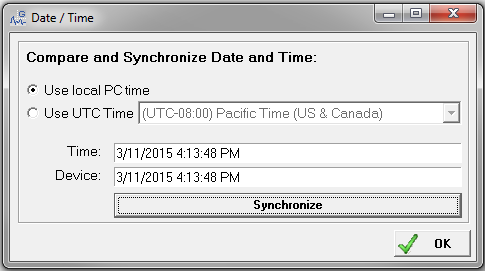
- Click on the Set RTC button to open the real-time clock configuration window. The real-time clock within the controller can be synchronized to the PC’s clock by pressing the Synchronize button.
- Select the Show online graph button to initiate test.viewer.
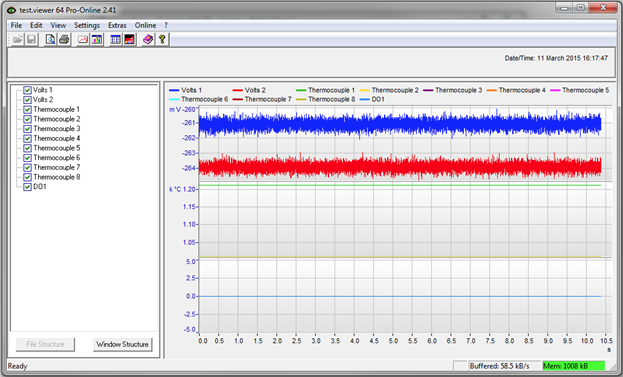
- The only difference compared to reading the buffer option is that the data is streaming live.
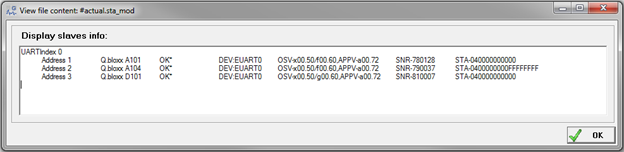
Read Slave Information Online
- Select File > Read Online Slave Info From Controller.
- The slave information window will appear. This window will display information from all slaves connected to the controller, including:
- Module address
- Module type
- Condition of module
- Firmware version of module
- Module serial number
Read Controller Information Online
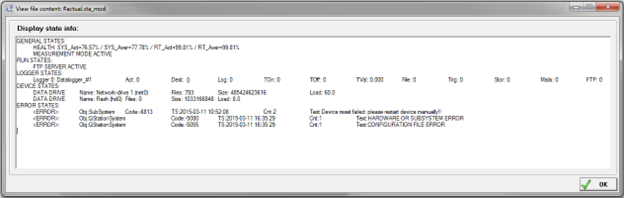
- Select File > Read Online State Info From Controller.
- The controller information window will appear. This window displays the general states of the controller, including overall health, logger status, any error states, etc.
Offline Mode
- In all the modes discussed above, we have used test.commander in an “online” mode. This means that actual hardware has been connected to the PC while test.commander is used. The great feature that test.commander provides is the ability to use it in “offline” mode. Essentially test.commander is always in “offline” mode unless project files and data files are being read or written.
- The benefit of offline mode is creating custom and theoretical projects to verify the functionality before assembling a real system.
- Create a new project. File > New Project.
- Give the project a name.
- Right-click on the mouse and select Add Controller within the empty project workspace.
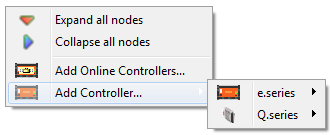
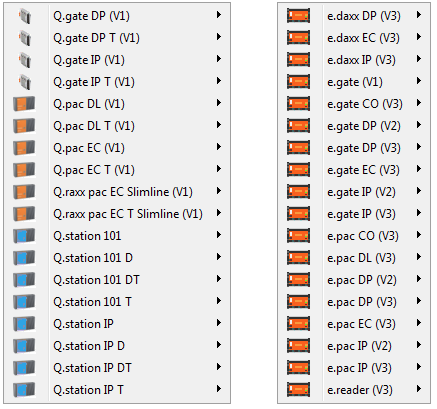
- Any Gantner controller can be added, whether an e.series or Q.series controller.
- Selecting a controller will add it to the project.
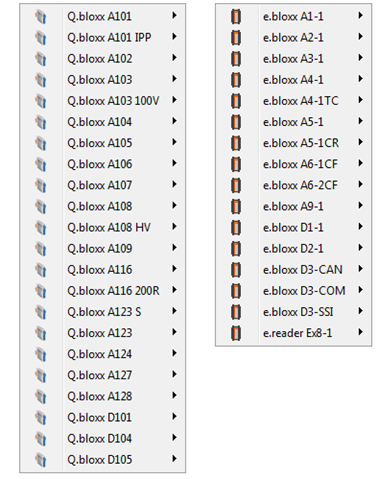
- Right-click on the controller and select Add Slave.
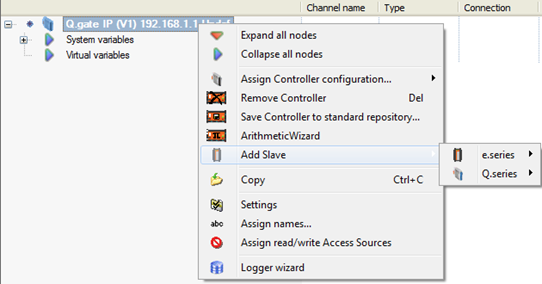
- The slave module can be an e.series or Q.series module.
- The UART and slave address must be specified for each slave module that is added.
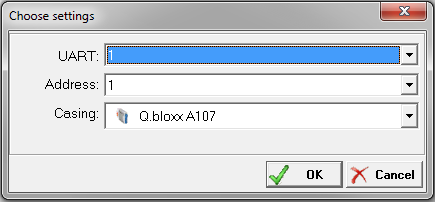
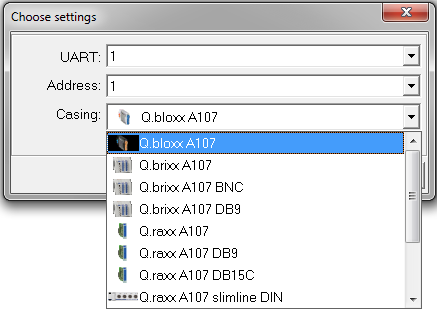
- The casing/package can also be selected here.
- Continue to add the necessary modules to the system. Pay close attention to UART and slave address organization.
- Adding modules of the same type can be performed using the copy/paste method.
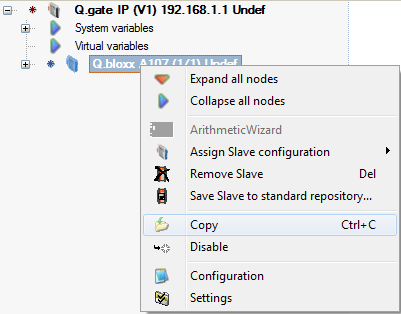
Right-click on the module and select copy:
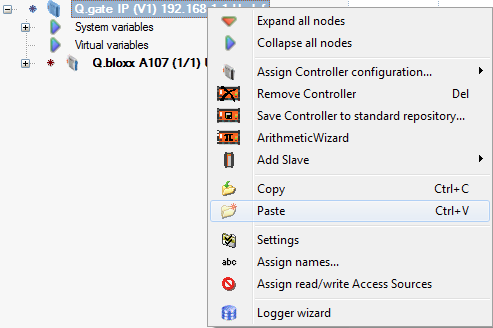
Right-click on the controller and select paste:
- With the desired slave modules added to the correct UARTs and configured with the correct slave addresses, the rest of the system settings can be modified.
- Settings such as sample rate, UART baud rate, channel count, etc., can be modified.
- After configuring the desired settings, the project's validity can be determined. File > Calculate Statistics.
- Select the Check button.

- This will open the design rule check window.
- This window will help determine if any changes need to be performed to the system's software settings and/or physical configuration. This may involve reducing or increasing the number of channels or modules, obtaining a higher-performance controller, changing the distribution of modules, etc.
Project Statistics
- Knowing a specific project's data format and layout is important, especially for various interfaces such as Modbus and Profibus. These are important information required by the host system.
- These statistics for every variable (real or calculated) are available in the statistics window.
- File > Calculate Statistics.
- This will display the required information for every variable within the current project.
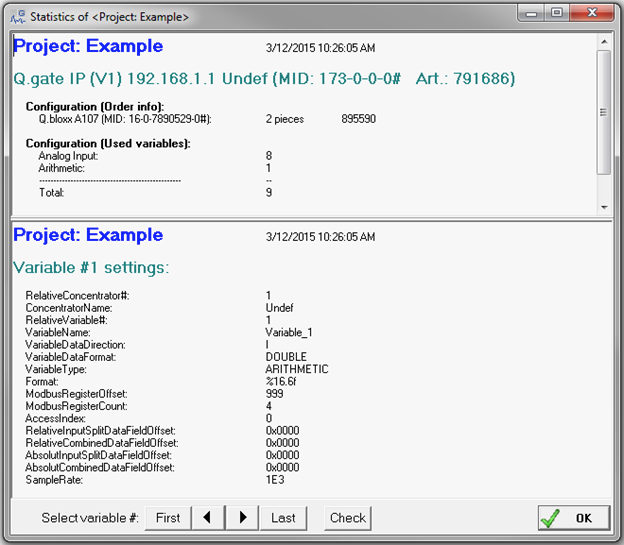
- Information provided includes:
- Variable name, type, and format
- Data format and direction
- Register location: count and offset
- Slave type, UART, and address
- Navigate to each variable using the left and right arrow keys at the bottom of the page. Fast forward between the first and last variables using the First and Last buttons.
Exporting Projects
- Projects can be exported to a zip file to be transferred to another PC. These exported project files can also be archived if they need to be used for future applications.
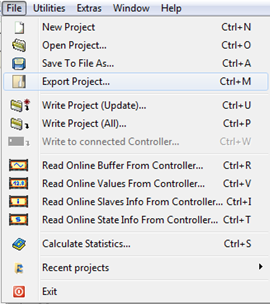
- Select File > Export Project.
- Give the zip file a name.
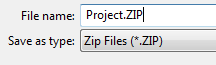
- This zip file can now be moved to another PC to be accessed by test.commander.
- This zip file can also be sent to Gantner technical personnel for evaluation and analysis.