How to configure a Q.station Data Logger with test.commander
Purpose
This document thoroughly explains how to configure and utilize the logging capabilities of a Q.station (DIN rail mount or Q.brixx version). For non-Q.station controllers (e.g. Q.pac, Q.gate) go to Logger Wizard section.
Items Required
- Q.station with adequate power supply (Q.brixx-station is supplied with an AC to DC
power adapter) - PC with a licensed version of test.commander installed
- Ethernet cable
Procedure
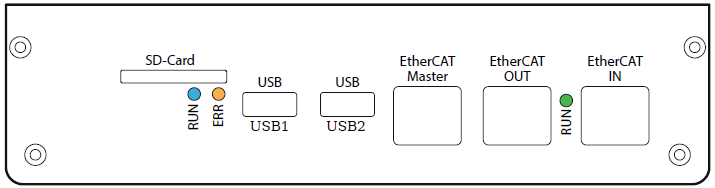
- Assemble hardware (Q.station + measurement modules).
- Power on hardware and connect the Ethernet cable between the PC and Q.station.
- Start test.commander. Create a new project.
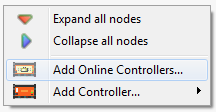
- In the empty project, right-click on the mouse and select Add Online Controllers.
- All controllers on the same network will be displayed, highlight the controller to connect
to and click OK.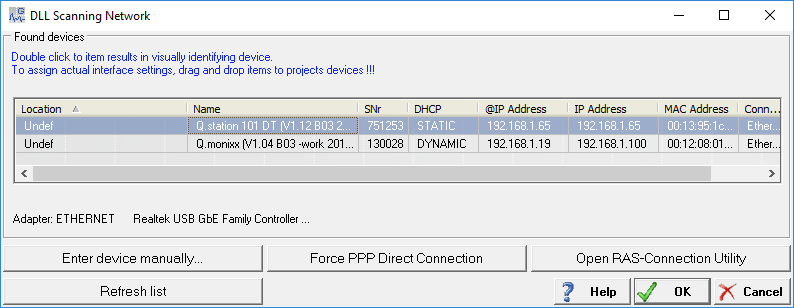
- When the controller is successfully added to the project, the following window will
appear:
- The Q.station and attached measurement modules will be displayed in the project work
space:
- Configure the channels (type, scaling, etc): real and virtual channels.
- Adjust the number of desired buffers/sample rates: Double-click on the Q.station,
Sample Rate > Count. By default, there is 1 x buffer used (maximum: 4).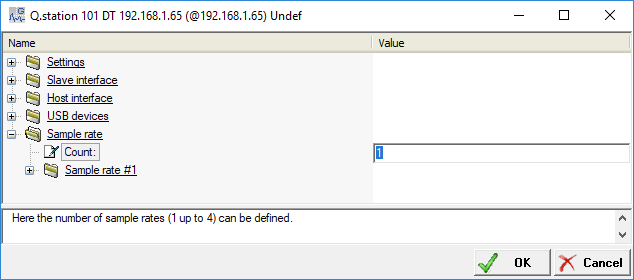
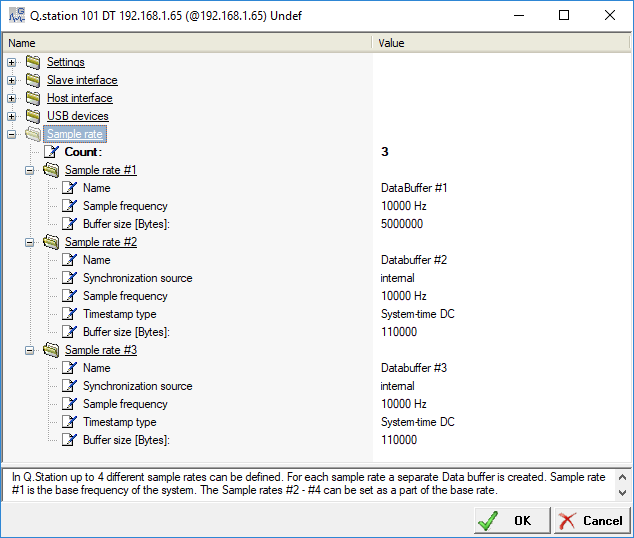
- Modify each buffer:
- Customize the name of each buffer.
- Modify the sampling frequency (buffer #1 must have the highest sample
frequency). - Modify the buffer size (the combined buffer size for all buffers can be a max of
200 MB). - Buffers 2-4 can be synchronized internally (use internal clock) or externally (digital
input on Q.station).
- In the main project space, assign which channels (real and virtual) belong to a certain
buffer. You should only use one buffer rate per UART (it is always possible to have
multiple logging rates use a single buffer). This is performed using the Sample Rate
column: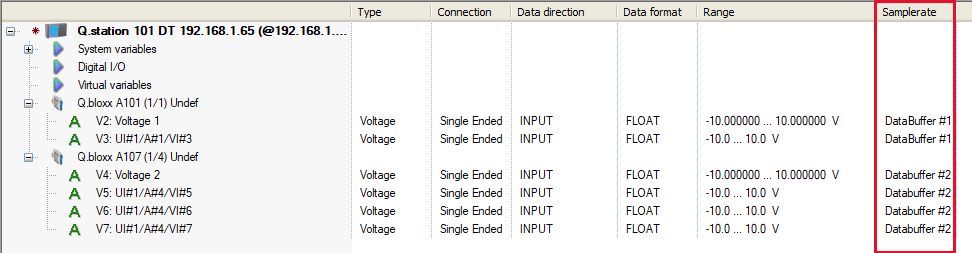
- Highlight the Q.station and click on the Logger Configuration button.
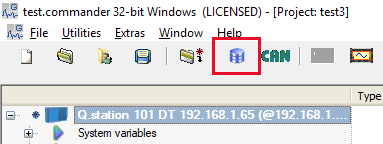
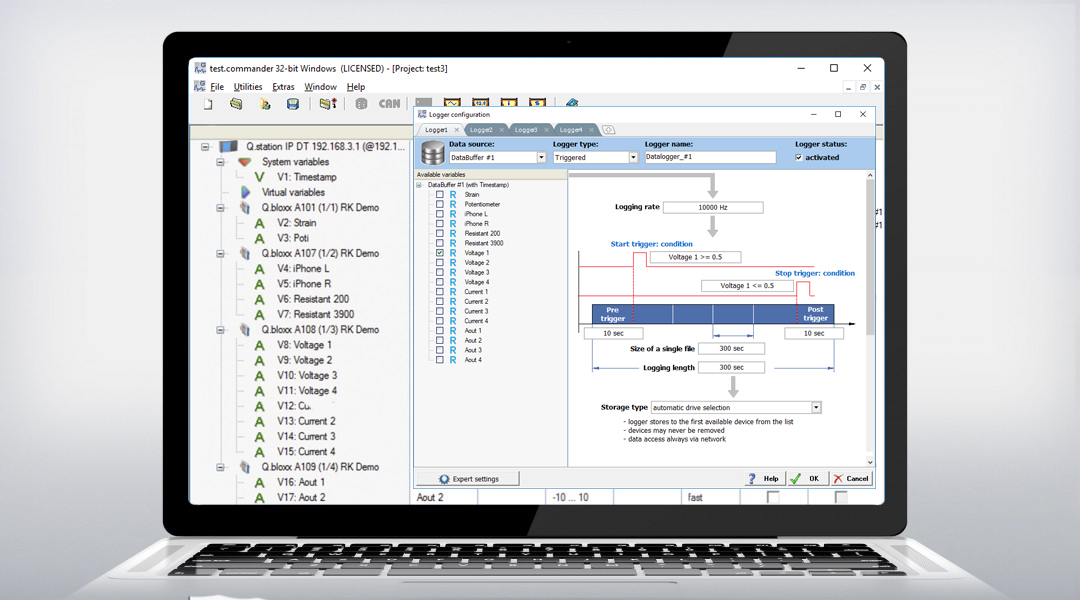
- The Logger Configuration window will appear.
- It is possible to add or delete a logger:
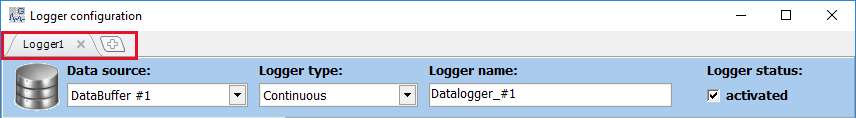
A maximum of (20) loggers can be created in a single Q.station. - For each logger, select the data source, logger type, logger name, and logger status:
- Data Source: select the buffer where the channels to save are located. Select
one of the configured buffers. - Logger Type: select between continuous, triggered, or event-based.
- Logger Name: provide a name for each logger. The data files will include this
name in the file. - Logger Status: activated or deactivated.
- Data Source: select the buffer where the channels to save are located. Select
- Select the channels to save within the logger. Only channels within the selected buffer
can be saved within that logger.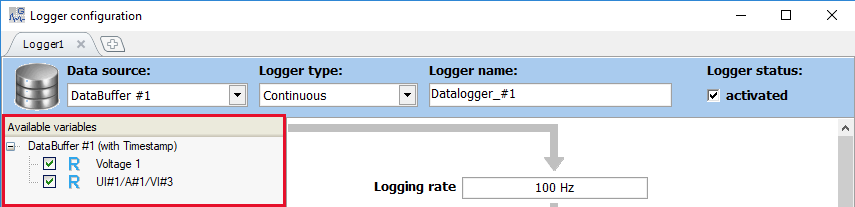
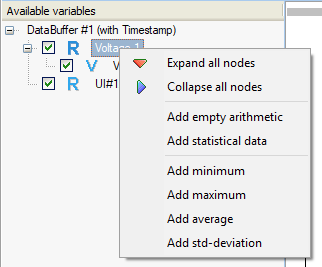
- Other arithmetic channels can be added to any of the available variables. Right-click on
the variable and select the type of arithmetic channel to add.- Empty arithmetic
- Statistical data
- Minimum, maximum, average, and standard deviation
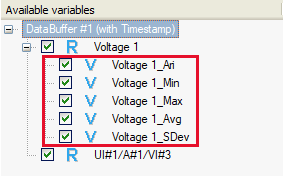
- Double-click on the new virtual variable to modify its equation.
- The logger type will determine the available triggering options
Logger Type: Continuous
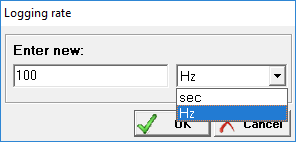
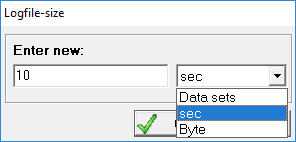
With this type, it is possible to select the logging rate of the logger and the size of a single file.
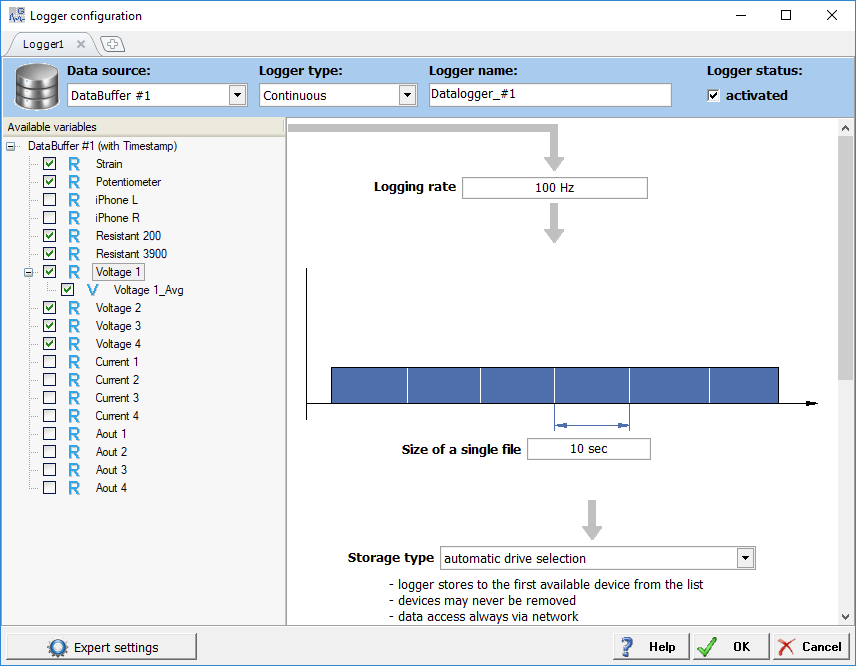
The logging rate can be set in seconds or Hz:
The size of a single file can be set in seconds, data sets, or bytes:
Logger Type: Triggered
With this type, it is possible to select the logging rate. It is also possible to assign start and stop trigger conditions; the channel(s) must be selected within the same buffer. Pre and/or post-trigger data can also be added.
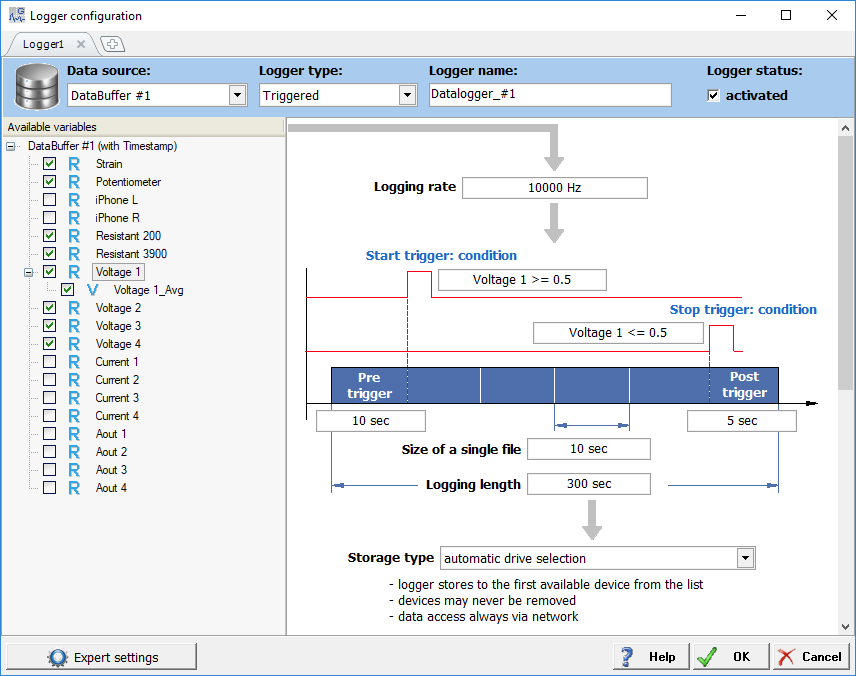
The logging rate can be set in seconds or Hz. The size of a single file can be set in seconds, data sets, or bytes; additionally, the pre and/or post-trigger data can be set in either seconds or data sets.
The possible condition arguments:
- < : less than
- <= : less than or equal to
- > : greater than
- >= : greater than or equal to
- == : equal
- != : not equal
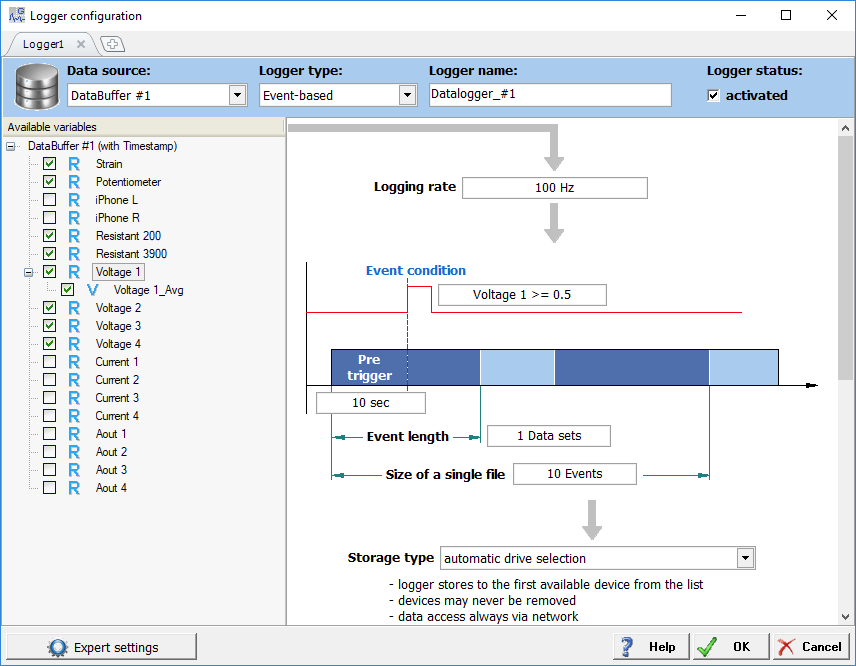
Logger Type: Event-based
With this logging type, it is possible to start logging based on an event. A pre-trigger is optional, while the event length can be specified in seconds, data sets, and bytes. The number of events specifies the size of a single file.
Data Storage
For all 3 logger types, the storage type can be chosen:
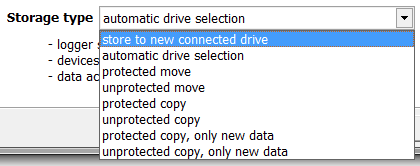
Default: automatic drive selection.
For more information regarding the other options, see section 7.3.3.5 in the Q.station
manual. This option determines how and in what sequence writing occurs to the
destinations.
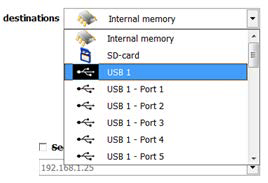
- The destination for each logger can be chosen next as either the internal memory of the Q.station, SD card, or USB port. The internal memory has a 100Hz logging rate limit.
- It is possible to send data to the following destinations: a network drive, an FTP server,
or via E-mail. How to configure these destinations is explained in separate guides that
can be found on the Gantner Instruments website:
https://www.gantner-instruments.com/us/support/support-tools/library-of-tools/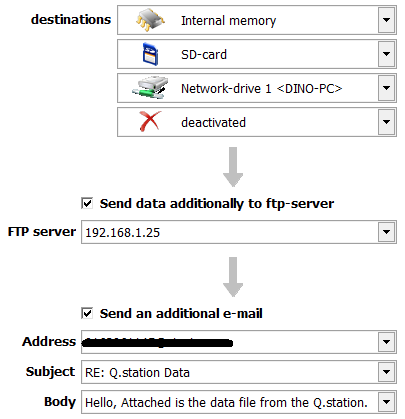
- Make sure to save the settings in the Logger Configuration window by clicking the OK
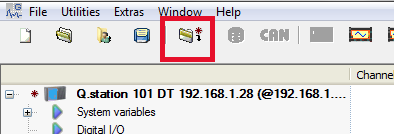
button. - Since a lot of changes have been made to the project settings and logging settings, these need to be updated in the controller. Notice a red star appears next to the Q.station. Click on the Write Project (Update) button to perform the update.
- After the update, the Q.station starts logging immediately (if continuous is
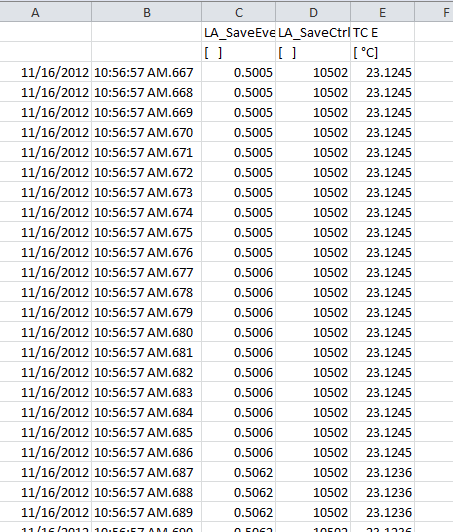
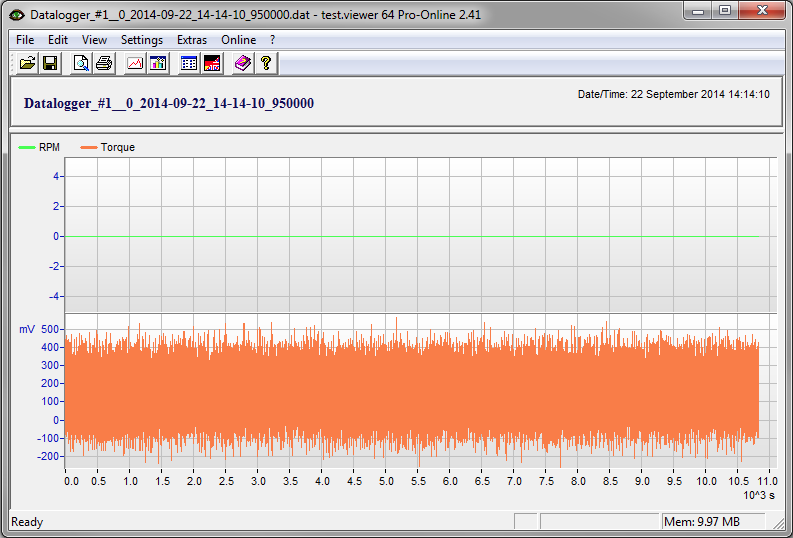
selected) or waits for the trigger conditions to occur. Files in the storage destination (i.e.
USB drive, SD card, etc.) are saved as .dat files and can be opened using test.viewer.
- Multiple data files can be appended together using test.viewer: File > Append File
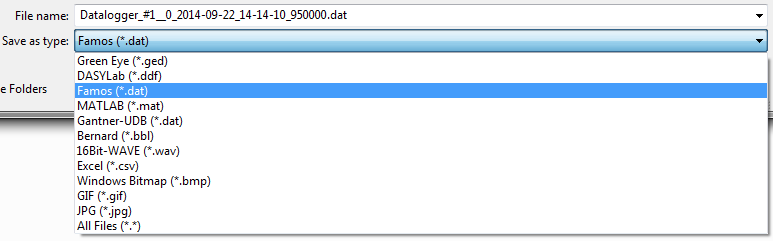
- Single or appended files can be saved into other formats: File > Save As
Logger Wizard (non Q.station controllers)
- Setup all desired channels in test.commander. In this example, I have 1 x TC type E
configured on an A104 module.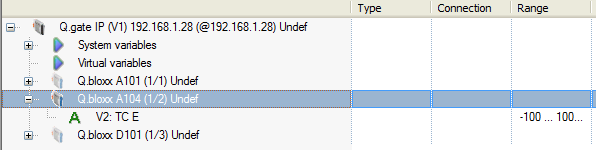
- Set up the desired sync rate of the Gantner system. Double-click on the controller
(Q.gate IP), selecting settings, synchronization, sync sample frequency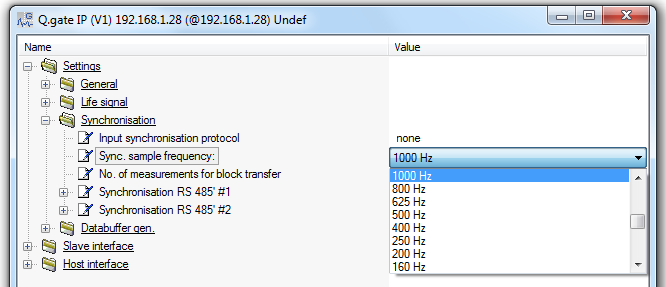
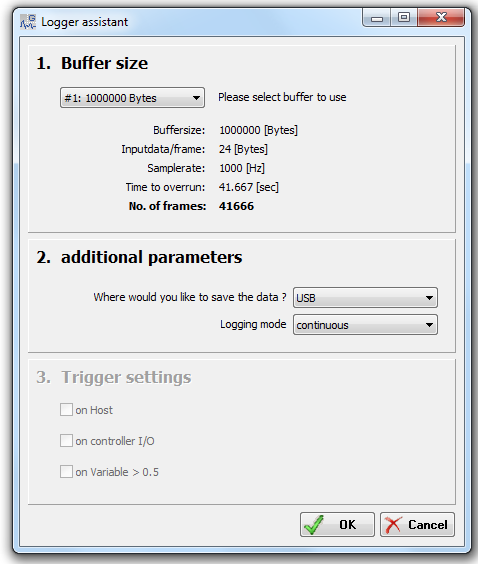
- Setup logging wizard:
- Right-click on controller
- Select Logger wizard
- Select which buffer to log
- Select the location to save data: USB
- Select logging mode: continuous
- Save the project to the controller.
- Click on read online values from the controller.
- Click on Set RTC: use local PC time, and click on synchronize.
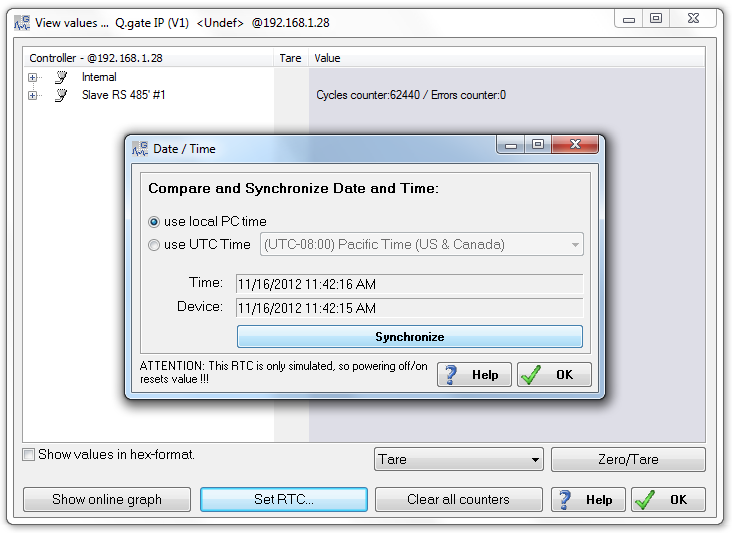
- Data is now being logged to the USB with time-stamped synchronized to your PC’s clock.
- Remove the USB from the controller and attach it to PC to collect data.
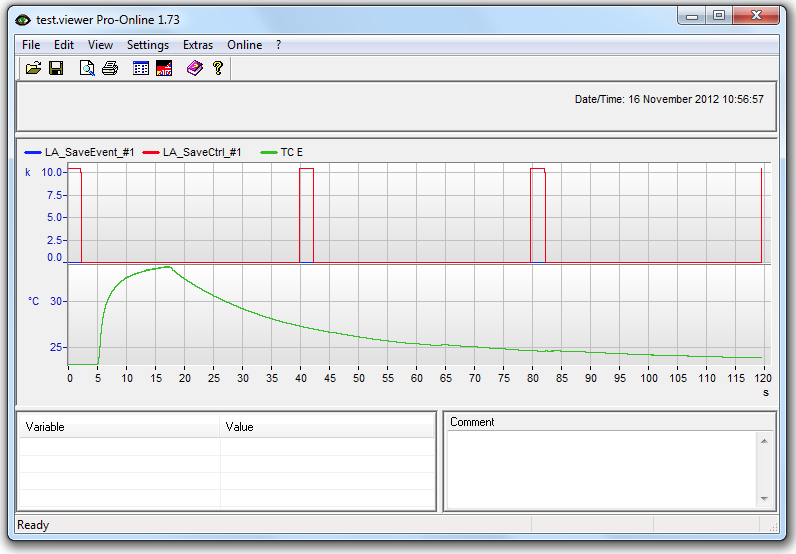
- Run test.viewer on PC
- Click on file
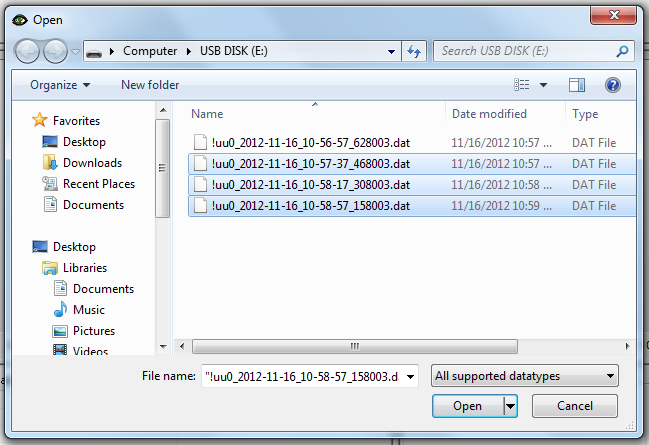
- Append file
- Select all files except the first file
- Click on Open
- Data from multiple files are combined on the screen
- Click on Settings, ASCII save options. Make sure milliseconds are checked and make sure Date & Time is checked. Click OK.
- Click on File, Save As, and choose the desired format.
- Notice that the time resolution is saved in milliseconds: