Step by step, how to set up a power analyzer with Q.boost and GI.bench
1. Connecting the Hardware
The Q.boost has to be connected via a USB 3.0 interface. 6 Channels at 2 megasamples/s will create 45Megabyte/s of data, which exceeds the 12 MB/s limits of USB 2.0. USB 2.0 would require a reduction of the samplerate, which is not desirable for power analyzing an inverter.
2. Starting GI.bench
Q.boost is accessed like a harddrive, which requires the GI.bench to be run as administrator. This allows GI.bench to run a high speed datastream for acquisition and processing of the data.
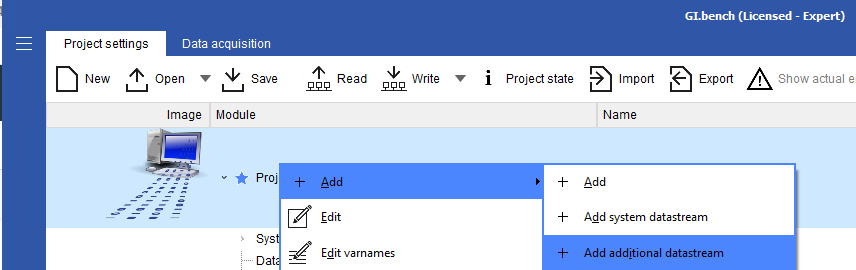
3. Creating the Additional Datastream for data acquisition
To access and process the raw data from the Q.boost Poweranalyzer an additional datastream is required. This can be done by right clicking the project and choosing "Add additional datastream"
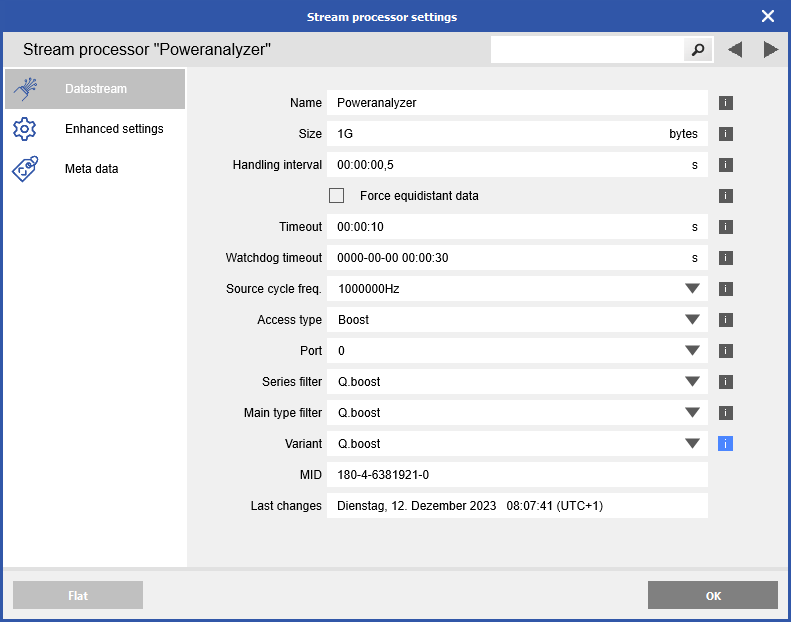
the next step is to edit the additional stream, assigning a fitting name and setting the buffer size to at least 1 GB. This will fit about 20 seconds of data for processing.
Source rate is the sample frequency of the Q.boost Poweranalyzer. When choosing Access Type Boost, both Series Filter and Main type Filter will set to Q.boost by default. Variant needs to be set to Q.boost, since the Power analyzer needs to be set up manually. It consists of two Q.boost HH modules for high voltage measurements and two LLP modules for current measurements.
When confirming the settings with OK, GI.bench will still show the red exclamation mark![]() .
.
The Stream now needs to be set up with variables which then have to be assigned to channels of the Q.boost Poweranalyzer. To create variables, right-click on the stream and choose "+Add" and choose to create 6 variables.
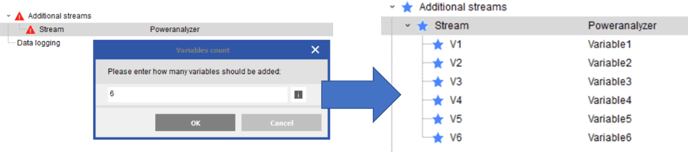
6 variables have been created and the red exclamationmark switches to a blue star, which signifies a valid configuration, which is not yet saved and written.
Before saving and writing the configuration, the channels need to be set up properly:
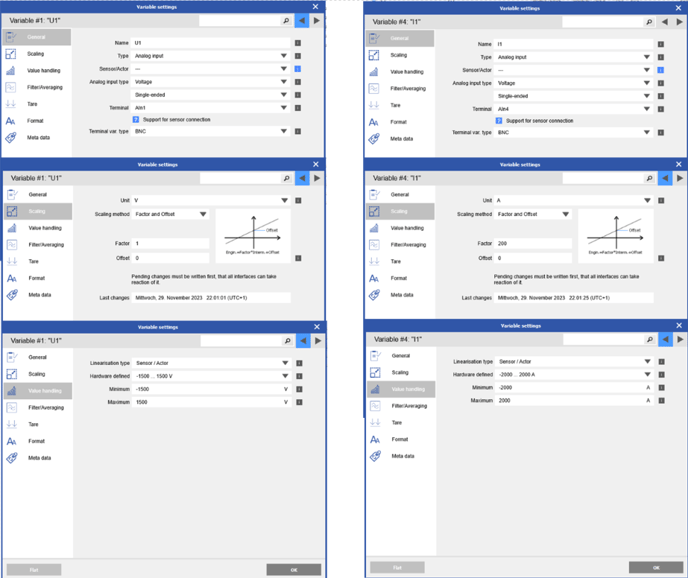
Scaling and measurement range need to be set up according to the application.
Warning! The Current measurement range has three ranges which are assigned according to the scaling. The ranges are ±1500V, ±10V and ±500mV. The Current input of the Q.boost Poweranalyzer is a LLP module, which only supports ±10V and ±1V. So only the ±10V range is available currently. The picture above shows factor 200 for the scaling of the ampere range, which results in a current measurement range of ±2000A.
Before creating the Enhanced Datastream for mathematical processing we suggest to check that everything up to now is running correctly.
To do this, save the project and switch to Data acquisition. The Q.boost Poweranalyzer should emit a short audible CLICK. The measurement data should now be visible.
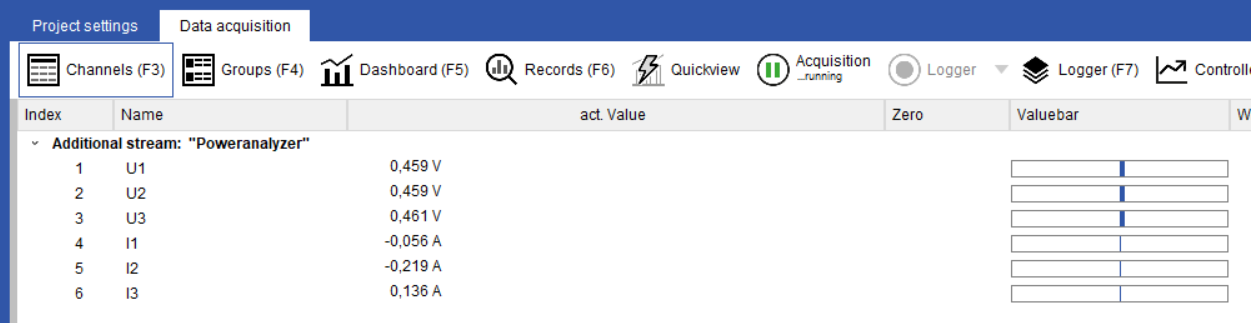
This signifies, that the setup is working.
Measurement data will only be shown, when a data stream can be created. If GI.bench is not run as administrator it is very likely that the configuration is correct, but GI.bench cannot create a datastream.
4. Setup of an enhanced datastream for the Calculations
Now we switch back to Project settings and right click the project to add an enhanced data stream.
GI.bench will create an empty data stream with a red exclamation mark just like the additional datastream we created before. Double click on the new datastream opens the edit window.
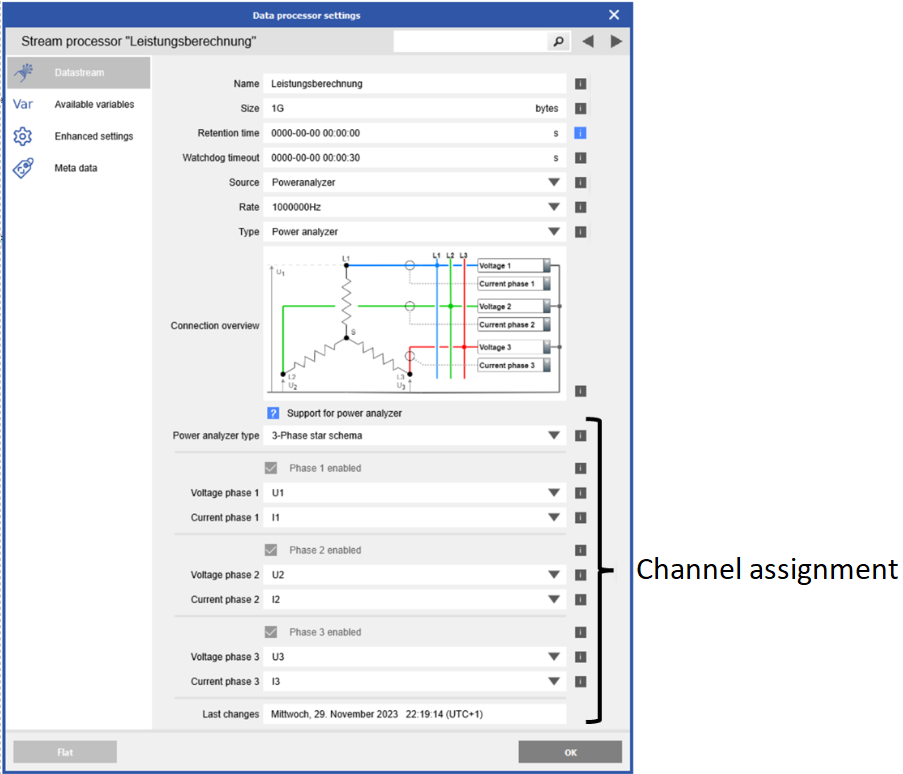
Set a fitting name and the buffer size to at least 1 GB.
Source is the previously created additional datastream and type is Power analyzer.
Currently it is only possible to configure a 3 phase star system. The Voltage and Current channels need to be assigned and the configuration confirmed with OK.
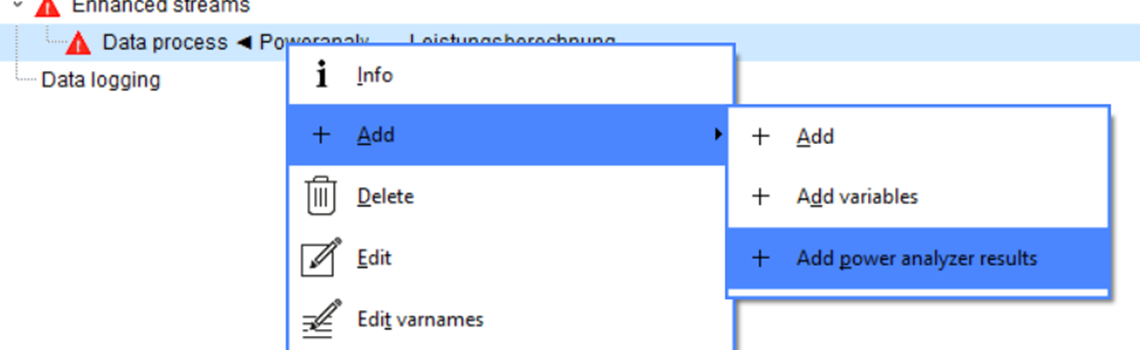
The red exclamation mark is still present, because there are no channels configured. Right click on the configured Stream, choose "Add" and "Add power analyzer results"
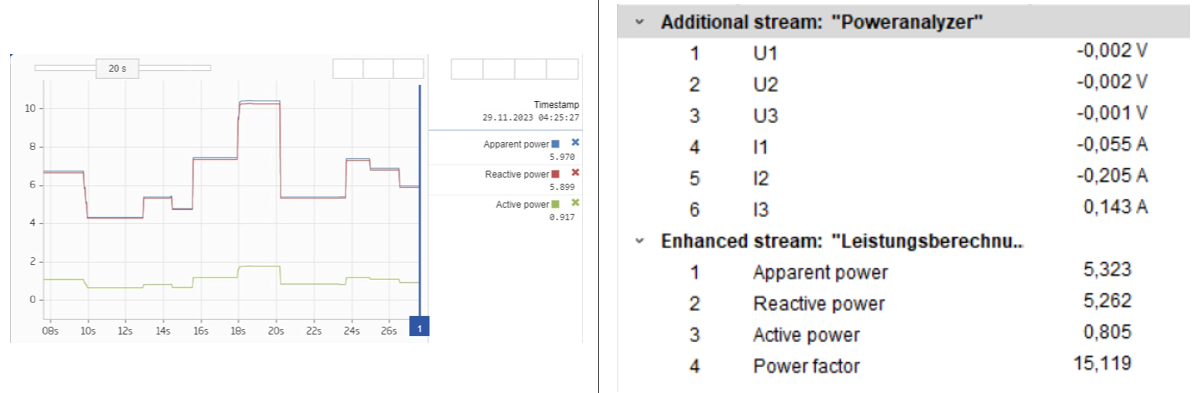
The following window shows the available calculated values. Choose the relevant values for the current application.
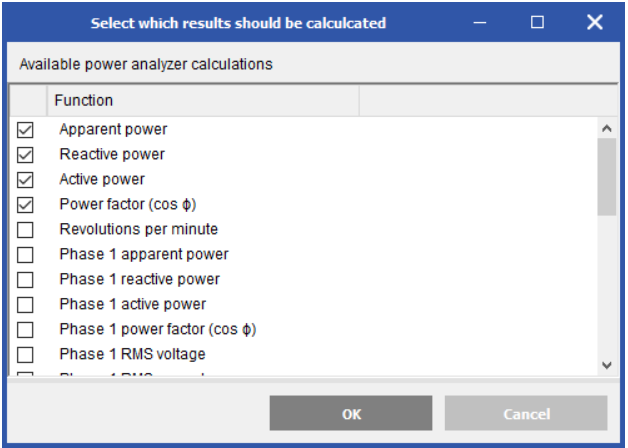
After choosing the results close the window with OK. The red exclamation mark will now switch to the blue star to show, that the configuration is now valid. Now we save the project and switch back to the data acquisition tab.
5. Visualization of the data
It is important to note, that the calculations only work with a rotating motor. If the motor is not running there will be no measurements. New values will only be generated when there is movement.