Hardware
The Q.boost line of hardware is able to sample data at up to 4MHz. Instead of connecting through a Q.station X controller, Q.boost devices connect to a PC or Q.core via USB 3.0. This is done with the Q.boost BC-S (bus coupling module).
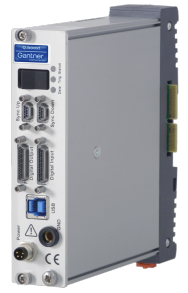
This provides the USB 3.0 interface for data transfer and communication, power supply, time synchronization for all connected Q.boost modules, and for connection for up to 8 Q.boost modules.
There is also sync ports for coupling to additional bus couplers to add more Q.boost modules. Also provided are 8 digital inputs and 8 digital outputs via micro DSub25 ports.
Configuration
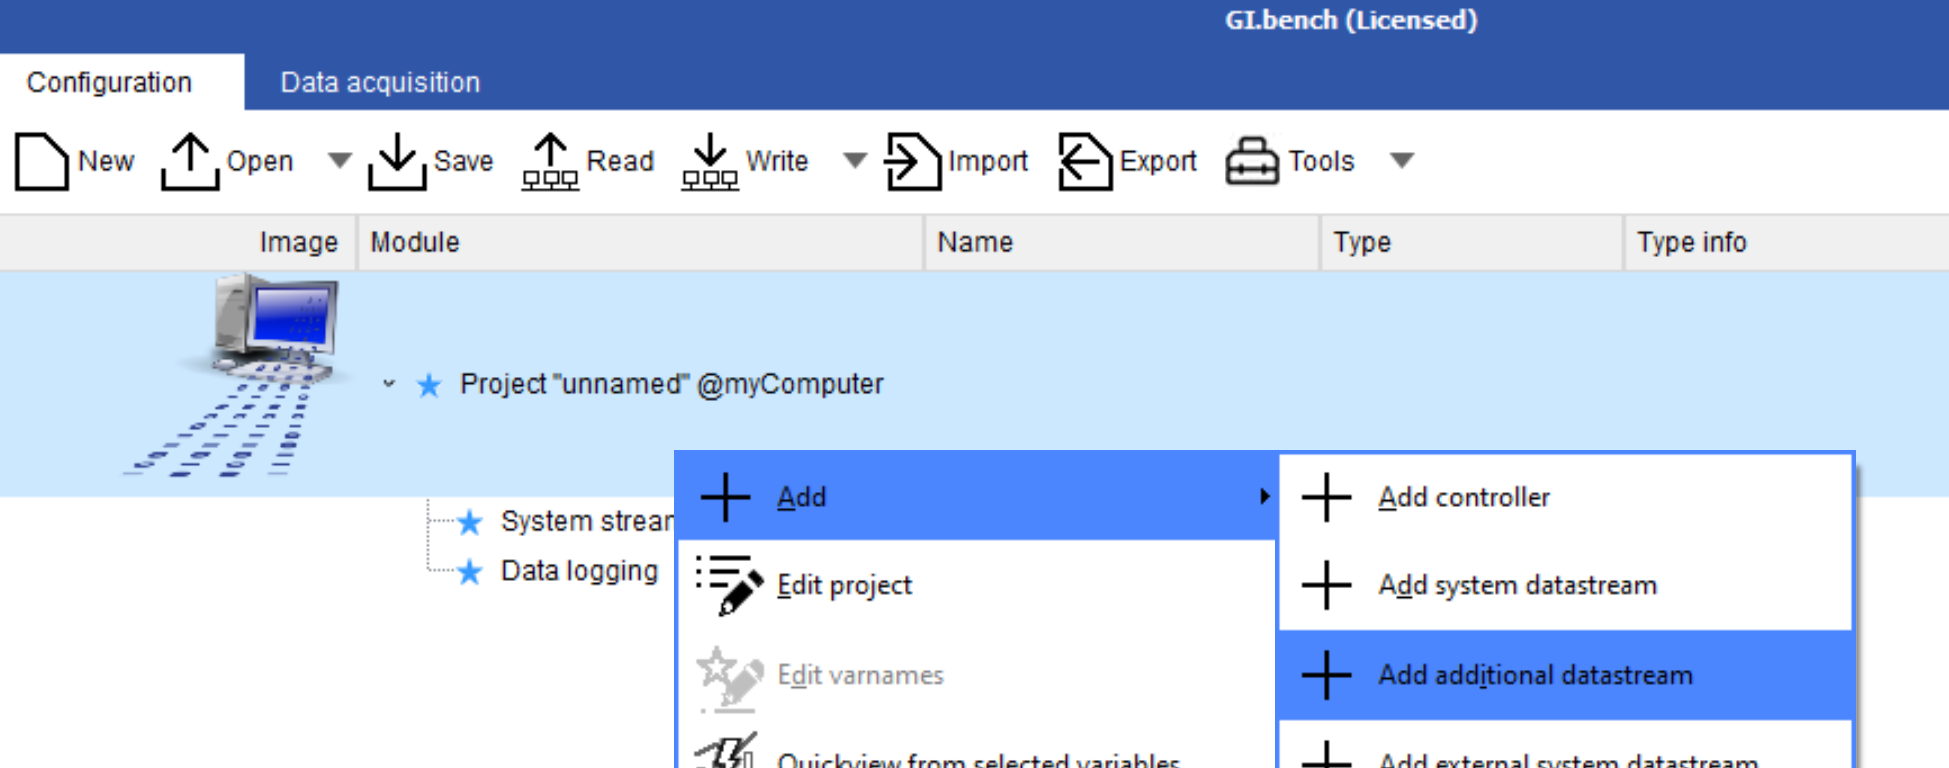
Once the hardware is connected to the PC or Q.core, configuration is done with the GI.bench software. Instead of adding a controller (e.g. Q.station), the analog inputs of a Q.boost module are added as variables to the Q.boost data stream.
- Run GI.bench software as administrator (right-click > Run as admin)
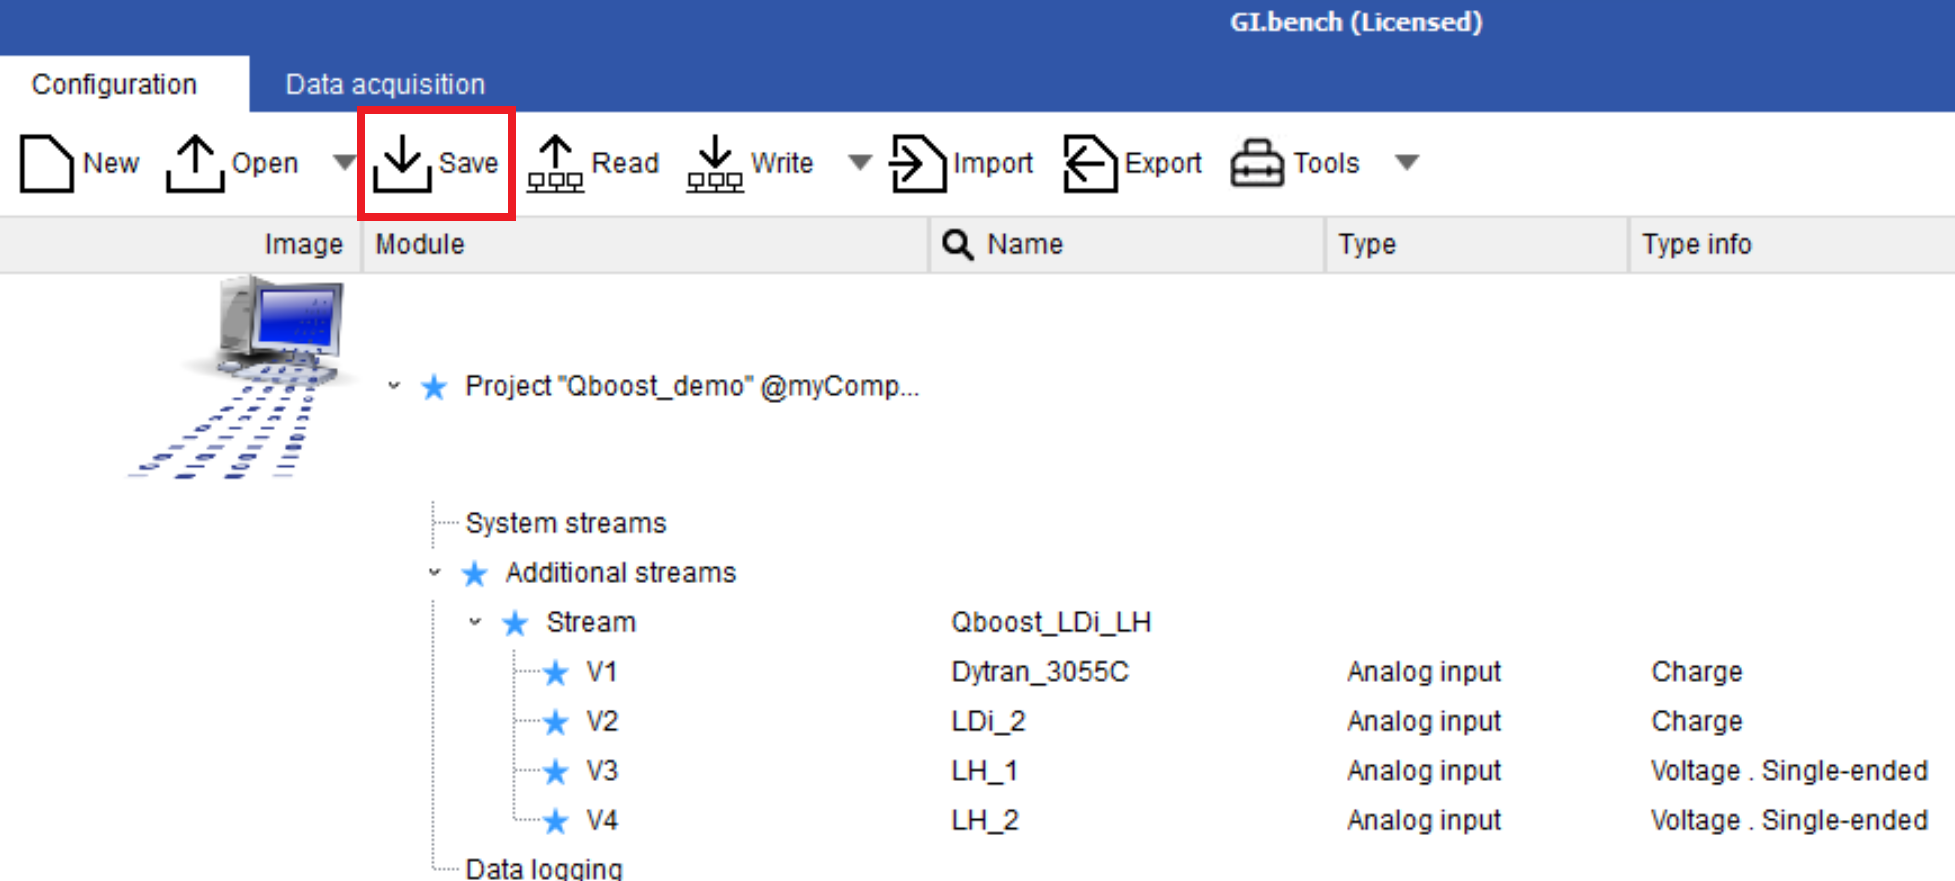
- In the configuration tab, right-click the Project/PC section > Add > Add additional stream
- Double-click (or right-click > Edit) the newly created stream under the Additional streams section to enter the Stream processor settings
- In the stream processor settings the things to consider
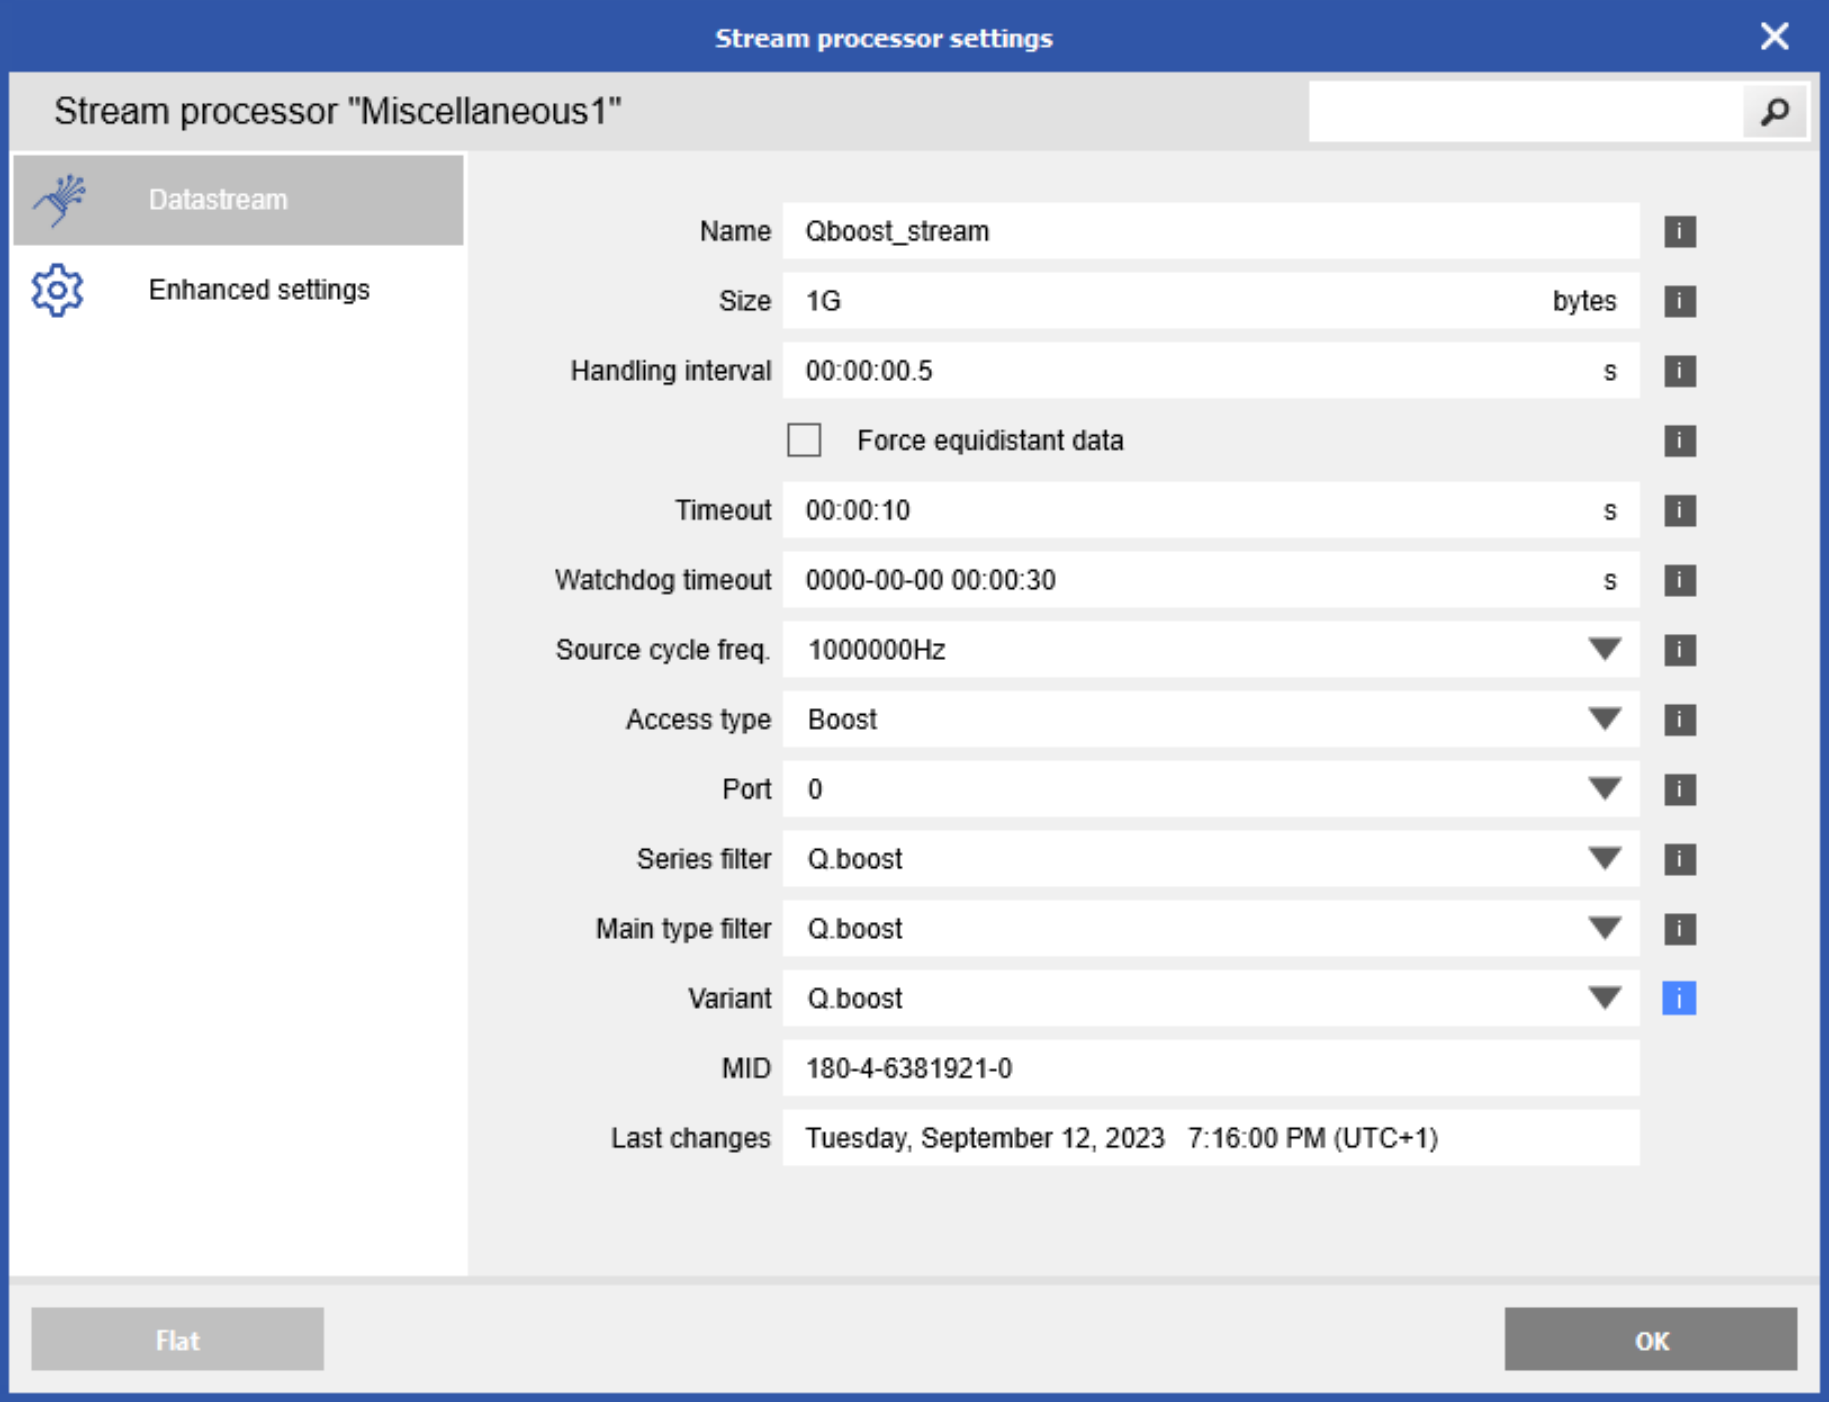
- Name: Enter a name for the stream to better identify it
- Size: Enter a value from 1M to 32G (bytes). Be sure to set a reasonable stream size if you are streaming at a fast rate (e.g. at 4MHz, use at least 1GB as size)
- Access type: set to Boost
- Source cycle freq: how fast the sample rate of the stream (up to 4MHz)
- Port: unused (leave at 0)
- Variant: Select the module type of the device connected. If connecting to more than one type of module, select Q.boost as the variant. (Note: this will give all the options when configuring the analog input, make sure to select the correct settings for the corresponding module type)
- Enhanced settings > Device serial numbers: Entering the module serial numbers is only needed if there are more than one system (more than one bus coupler). This is to define the sorting of the channels among the systems within the stream.
- Right-click the stream > Add > Append variables
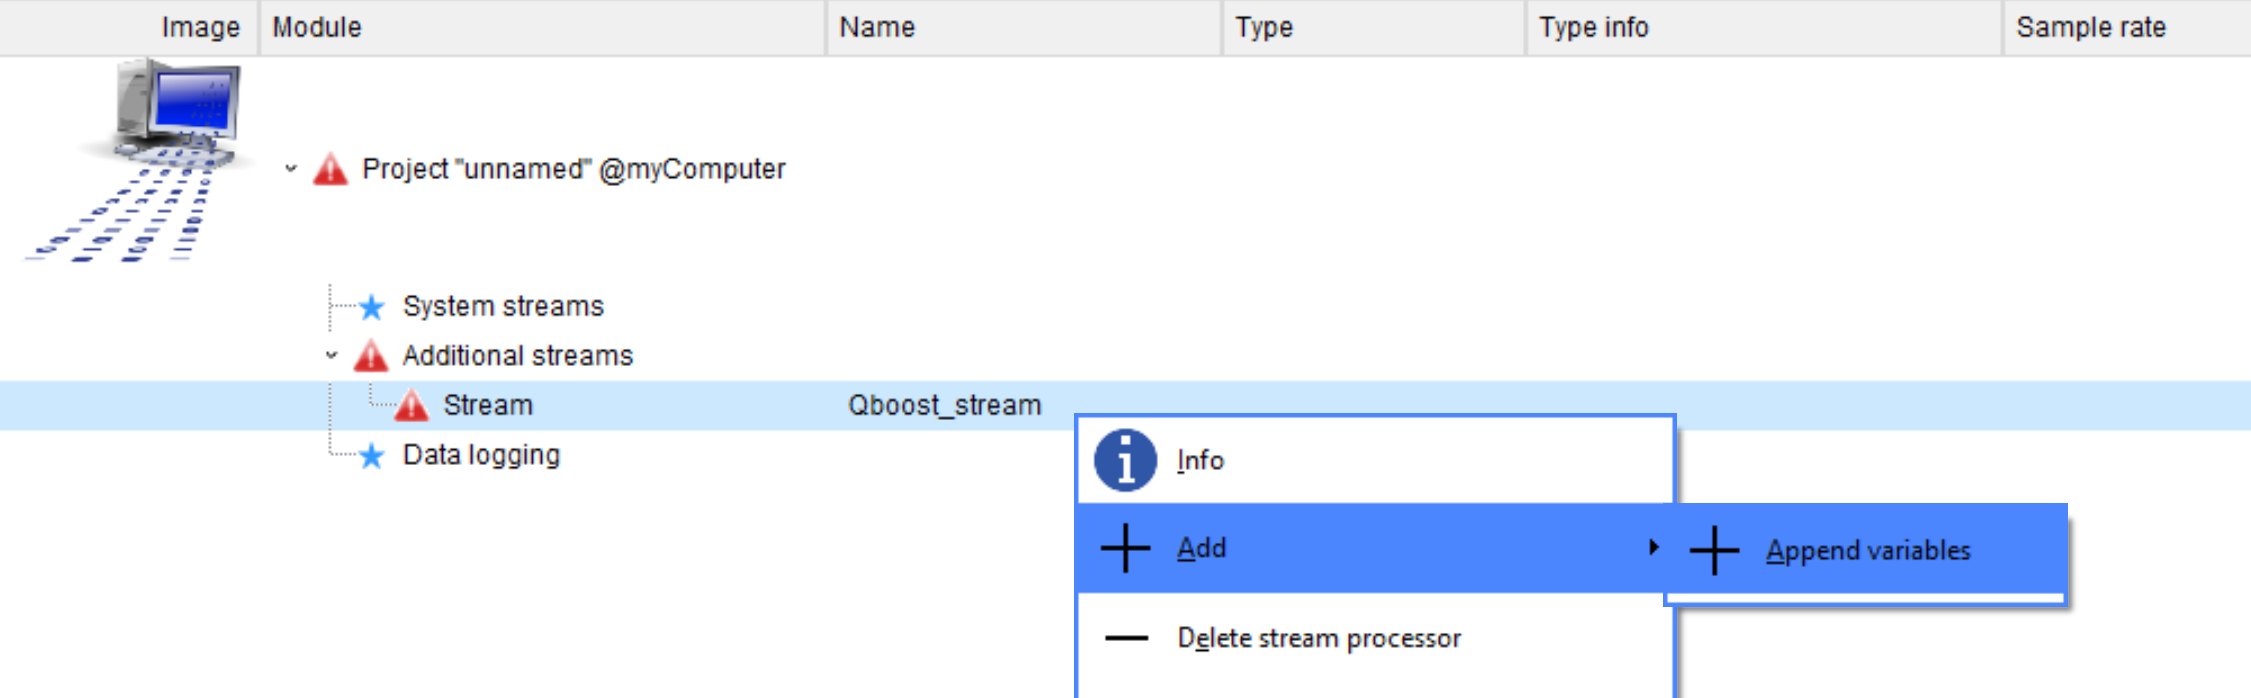
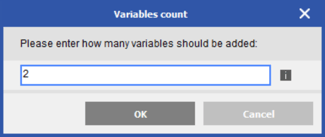
- Enter the number of variables to be created. Q.boost modules typically have 2 analog inputs. The newly created variables will be listed under the stream.
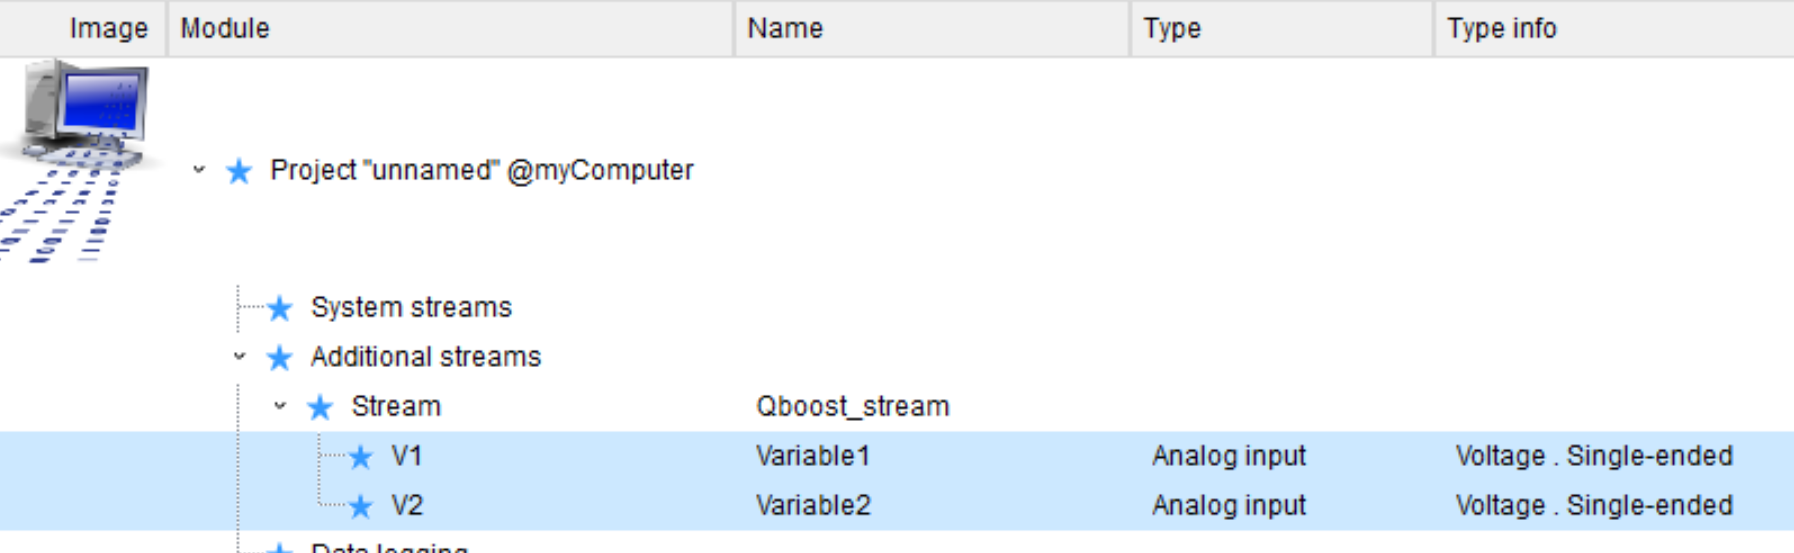
- Double-click (or right-click > Edit variable) to enter the variable settings window.
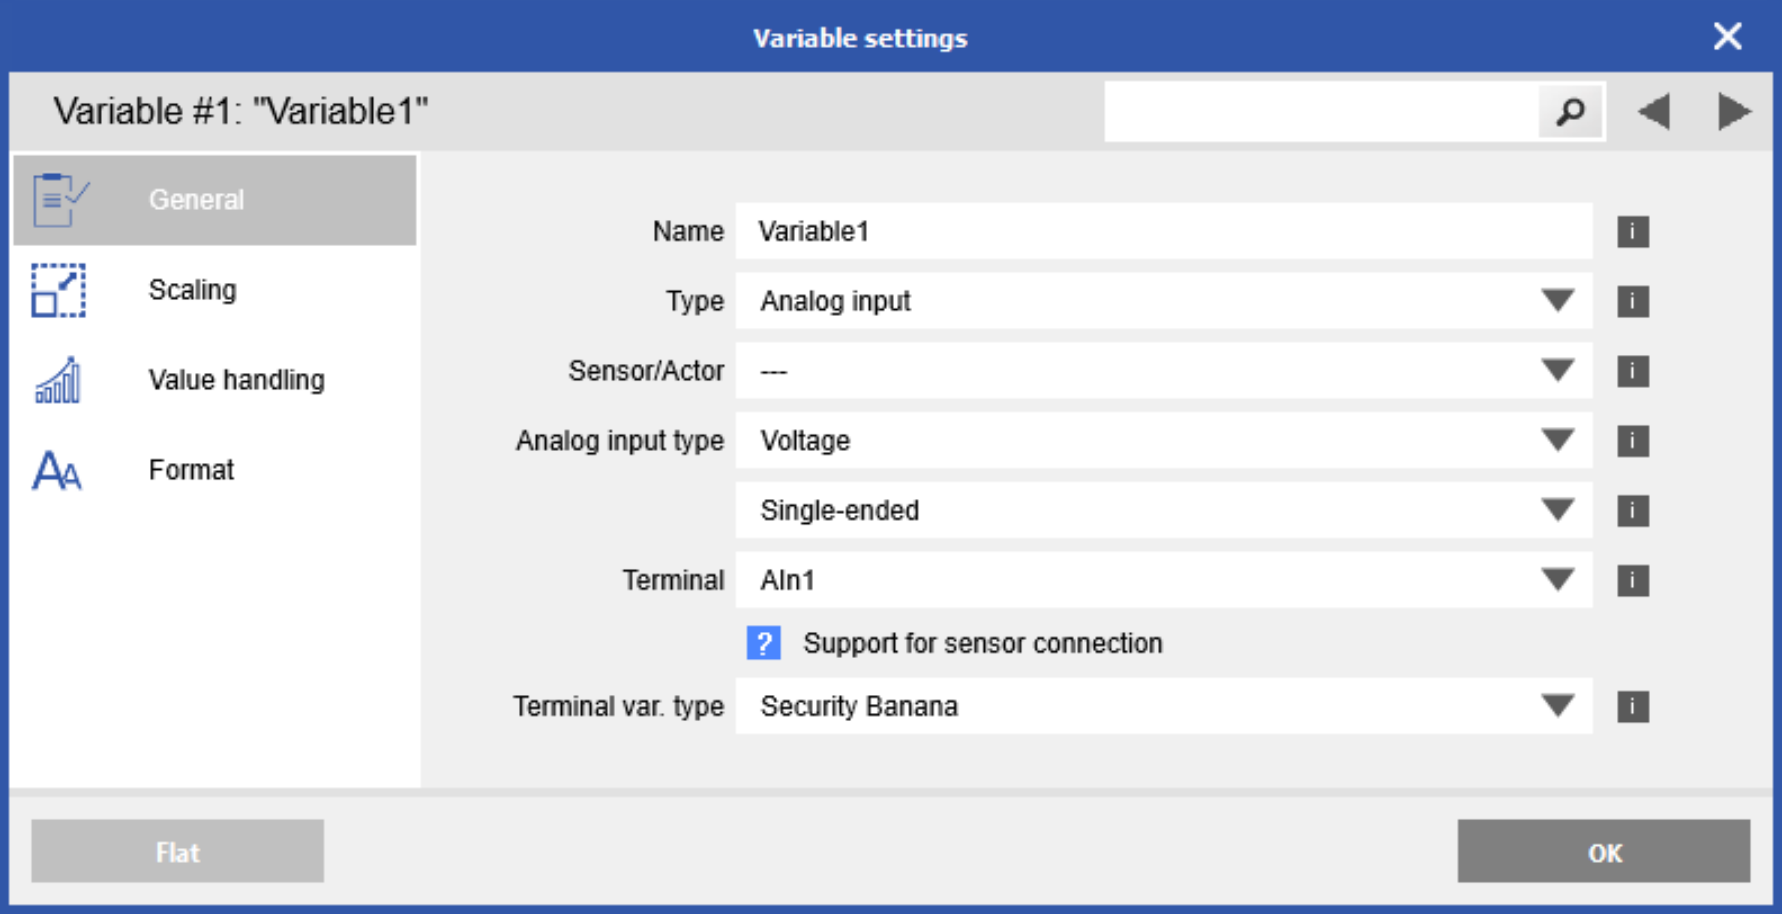
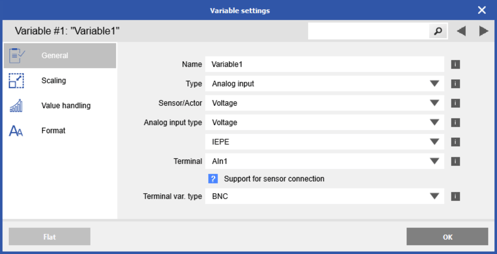
- General
- Name: Give a unique name to the variable
- Type: Select Analog input
- Sensor/Actor: Select the sensor type based on the module type (e.g. Q.boost LDi can be configured for Bridge/Charge/Voltage)
- Analog input type: Depending on the sensor, additional parameters may need to be set (e.g. voltage, voltage, IEPE/single-ended)
- Terminal: Select based on the location of the channel
- Module 1 - channel 1: AIn1
- Module 1 - channel 2: AIn2
- Module 2 - channel 1: AIn3
- Module 2 - channel 2: AIn4
- .....
- Terminal var. type: Select based on the connector of the module (e.g. LDi has BNC)
- Scaling
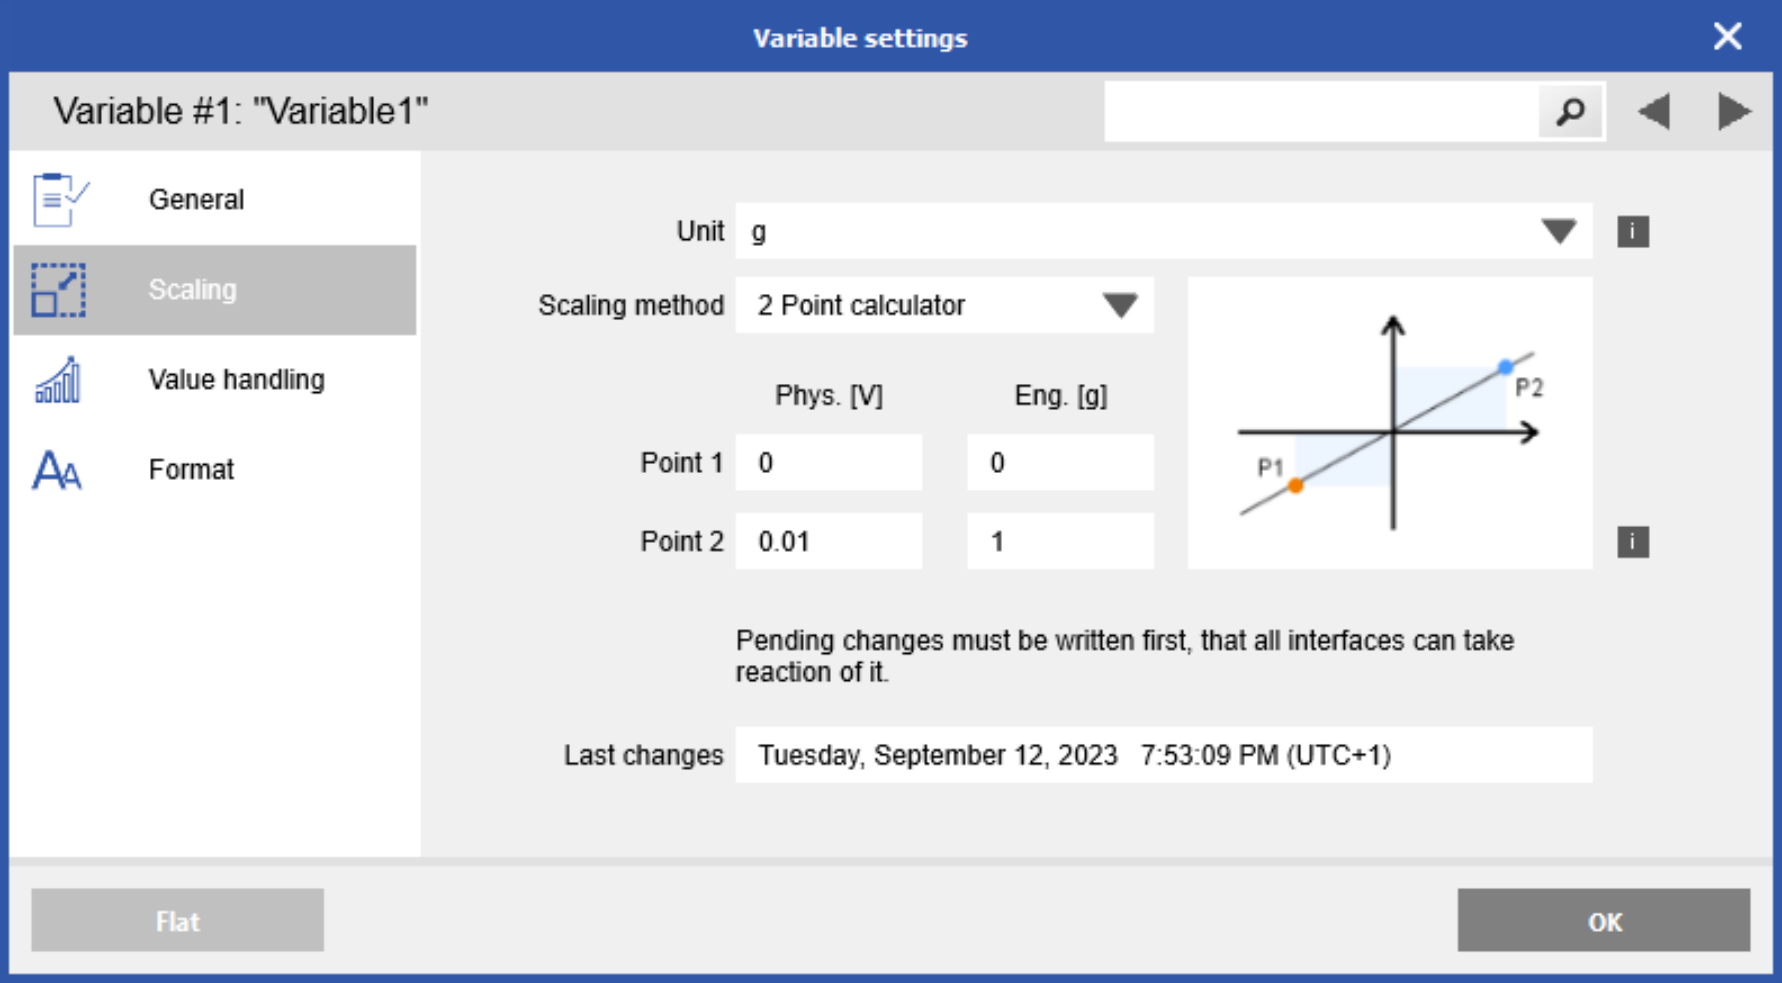
- Unit: select from the drop-down list or enter desired unit manually
- Scaling method: scale from physical to engineering unit by factor & offset or 2 point calculator
- Value Handling
- Linearisation type: Sensor/Actor (based on scaling section) or Polynomial
- Hardware defined: select the measurement range. Make sure to select correct range based on module type and channel number.
Example Q.boost XL LH- channel 1 (top) can be ±500mV or ±10V
- channel 2 (bottom) can be ±500mV or ±10V (with BNC) or ±1000V (with banana connector)
- Format: Enter the FieldLength (value length of data) and Precision (number of values after decimal)
- General
- Click OK when done making changes to the variable. Repeat for any additional variables. Save changes to project.
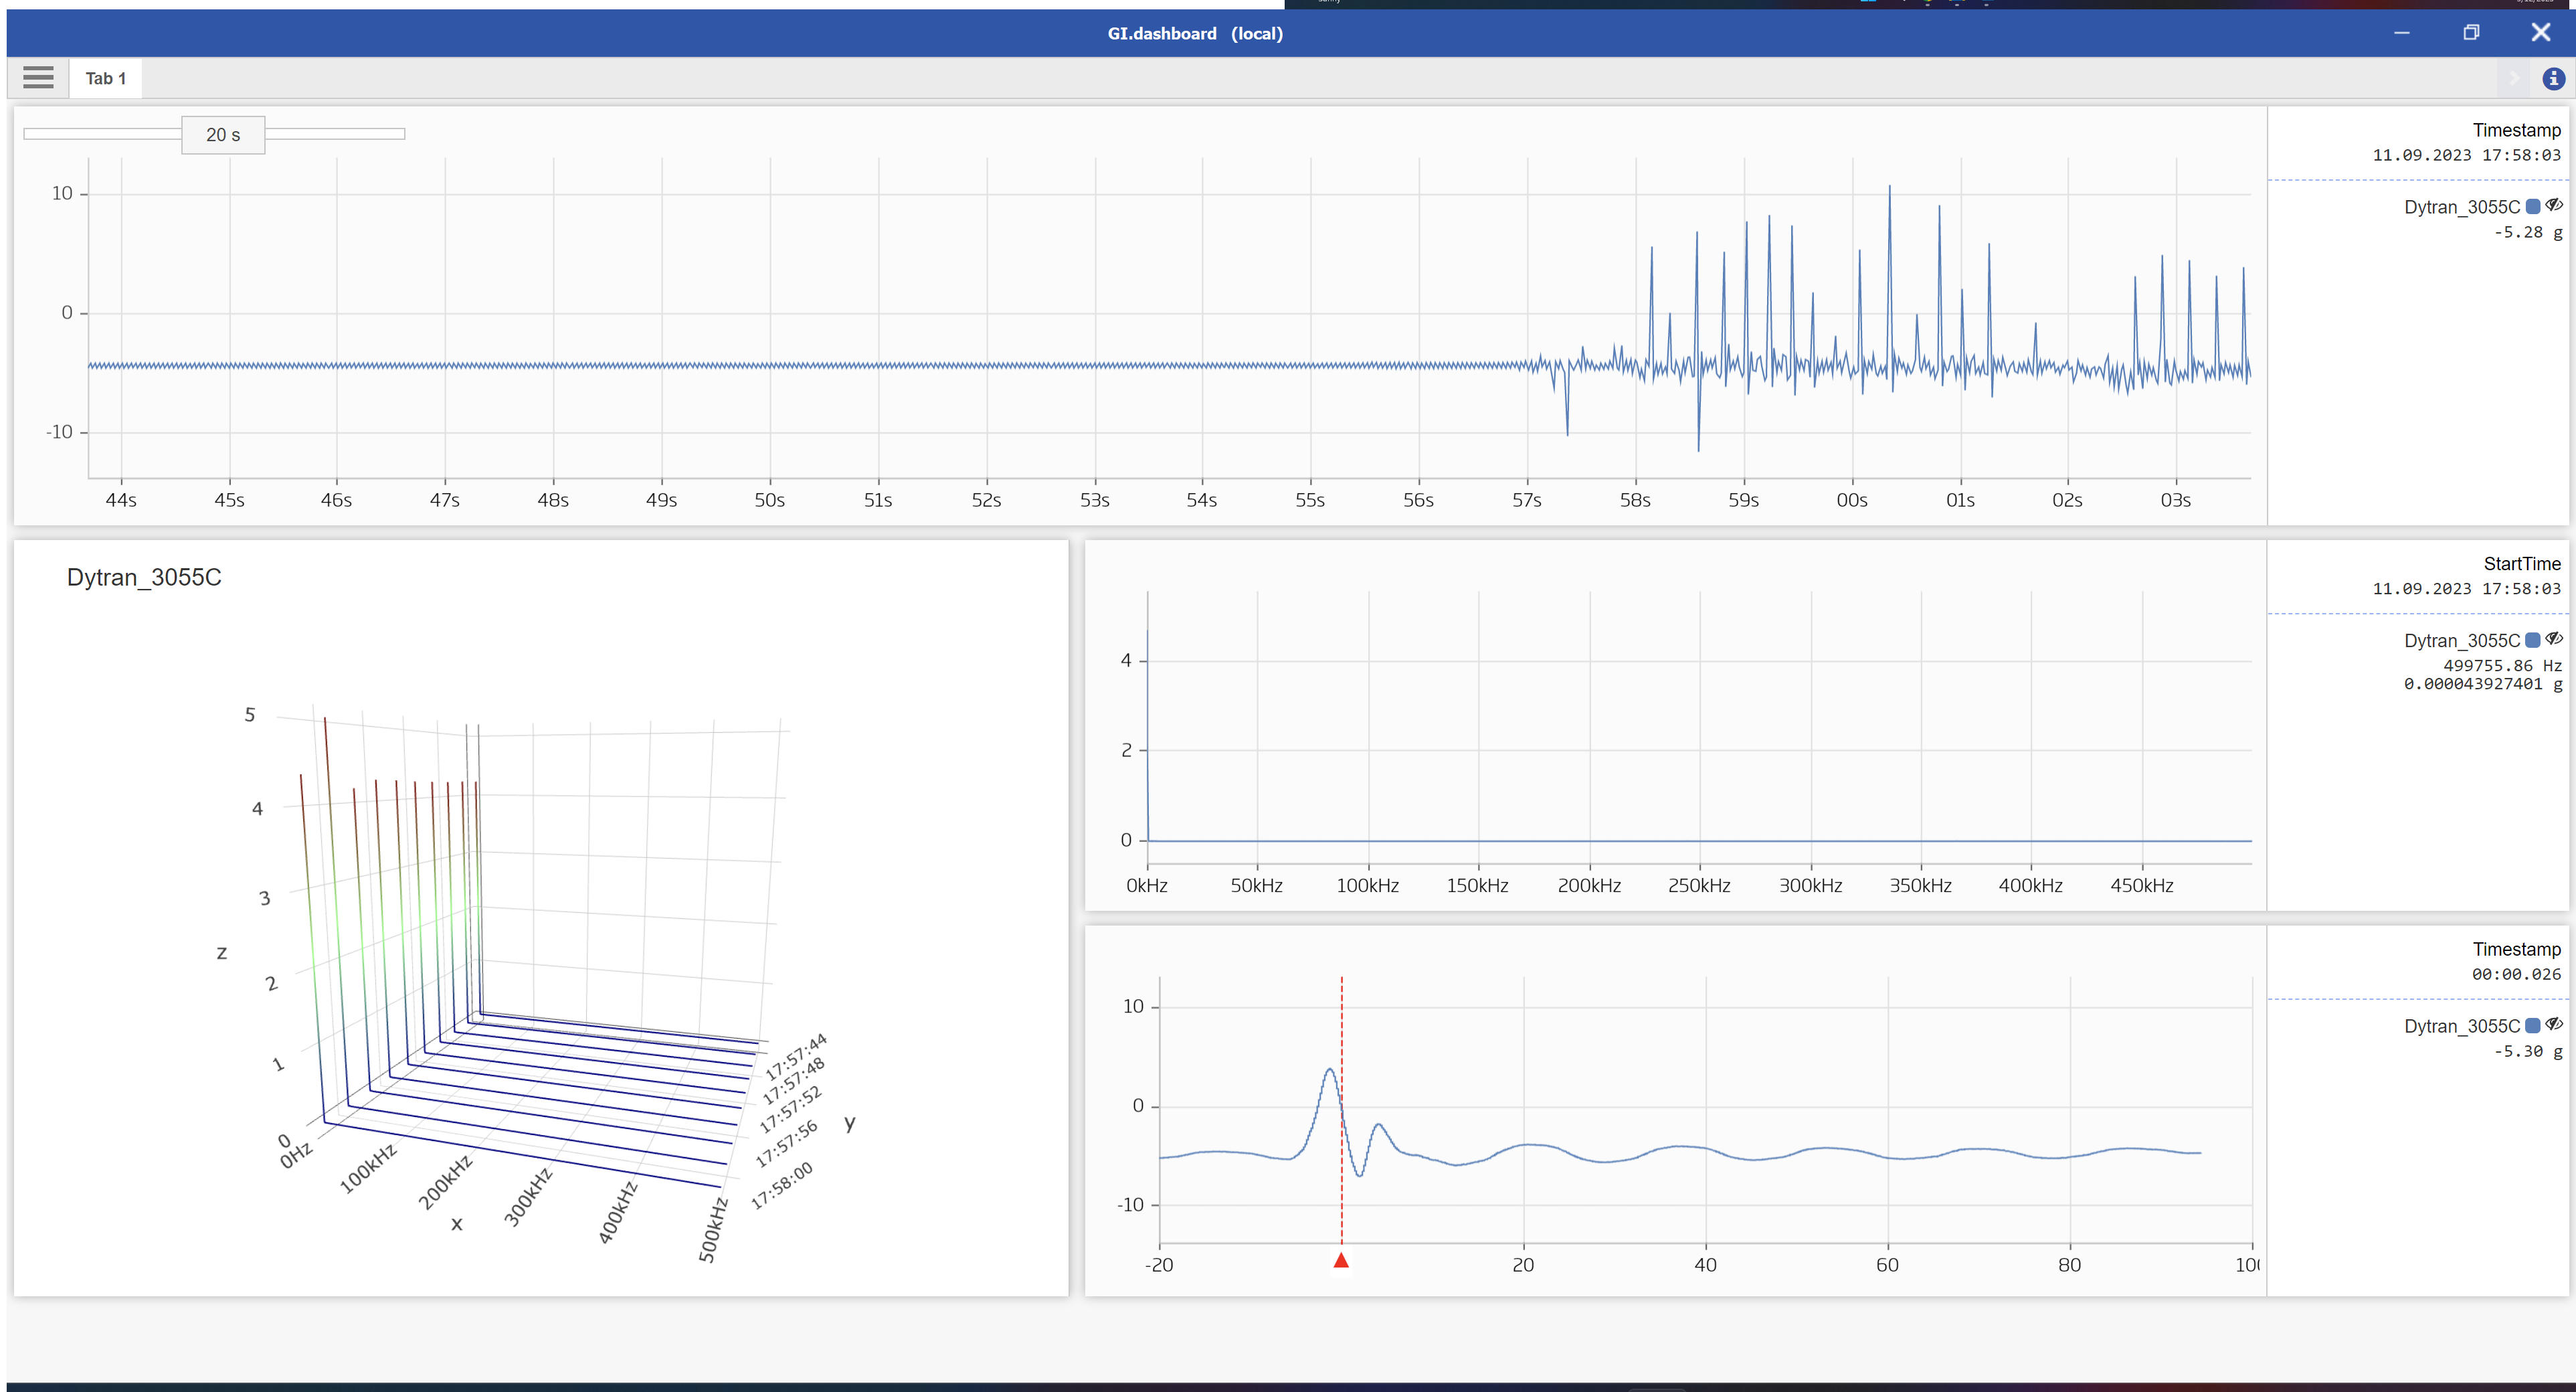
Visualization
- Switch to the data acquisition tab. This also when any changes are written/applied to the module(s). Under the Channels section, expand the Additional stream to see the list of variables and the live values
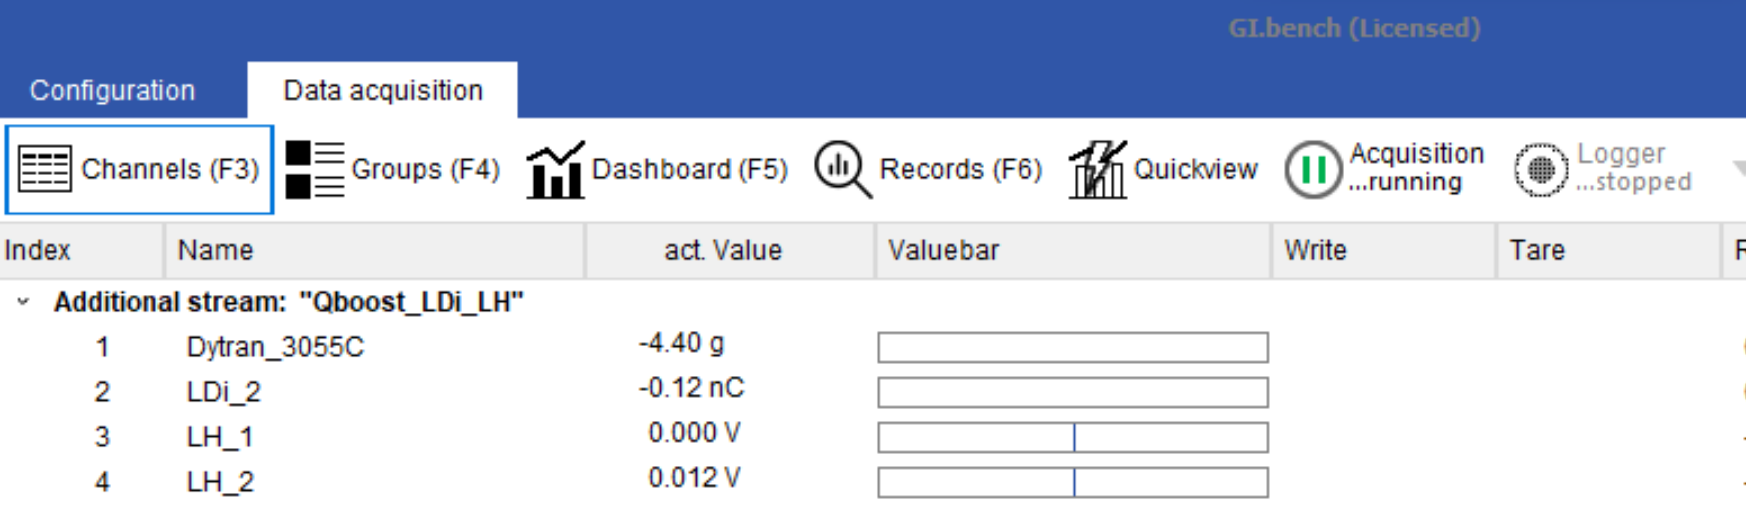
- Continue to visualize and/or create data loggers as needed