![favicon_GI.png]](https://knowledge.gantner-instruments.com/hs-fs/hubfs/favicon_GI.png?width=40&height=40&name=favicon_GI.png)
Table of Contents
- Introduction
- GI.bench Software Installation
- System Configuration
- Data Streams
- Data Loggers
- Data Visualization
- International Sales and Technical Support
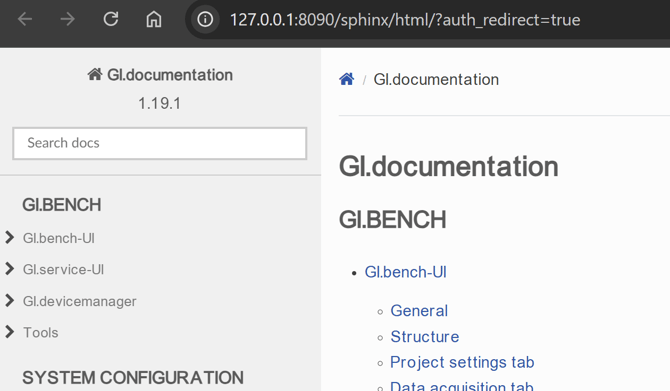
GI.bench is constantly being updated with new features. For the latest information, check the help GI.documentation by right-clicking the GI icon in the PC taskbar > help or clicking Help in the Cockpit window.
1. Introduction
1.1 Purpose
GI.bench is the latest multi-function software package developed by Gantner Instruments. It is used for all configuration, visualization, and data logging tasks involving Gantner data acquisition (DAQ) systems. Any Q.station test controller, in any housing type, or the Q.monixx, is required to use the GI.bench software. If you are interested in acquiring GI.bench, you may send an inquiry or contact Gantner Instruments for more information.
This How-To guide covers how to install and setup the GI.bench software tool as part of a complete Gantner DAQ solution. This guide also describes various basic features and capabilities of GI.bench and how to best utilize them.
1.2 Software & Firmware Downloads
The firmware version(s) of the controller(s) must be updated to match the version of GI.bench. You can request the latest test controller firmware and GI.bench software version(s) from Gantner’s technical support. Failure to keep firmware and software updated to the latest versions can sometimes cause disturbances during operation via communication failures. See Chapter 9.0 of this guide for the controller firmware update process.
Regional Technical Support: https://www.gantner-instruments.com/support-downloads/technical-support/
1.3 Recommendations and Restrictions
- PC Specifications:
- Minimum OS: Windows 10
- Recommended RAM: 4 GB
- Recommended Processor: Dual Core (2+ GHz)
- 1 x Ethernet port (minimum)
- 1 x USB port (minimum)
- Compatible Gantner Instruments Test Controllers:
- Q.station X, Q.station, or Q.monixx
- Always update controller firmware to the latest version; see Chapter 9 for firmware instructions
- Do not use a bootable USB drive with a Q.station type controller; the controller will not start
- Avoid switching between test.commander and GI.bench for configuration. Save existing test.commander projects for future use, if necessary.
- A GI.bench project is component-specific and cannot be distributed amongst similar systems
- By using enhanced streams, the configuration can involuntarily change after reading a controller. Please control this parameter before writing your project.
1.4 GI.bench Overview
The GI.bench user interface can be used to fully configure Gantner DAQ systems, visualize measured values, and perform redundant data logging. There are many features and capabilities within GI.bench but the user interface remains rather simple to navigate and learn.
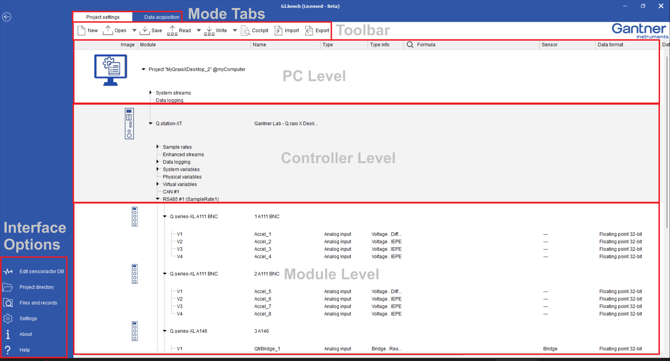
The following describes the operational mode tabs, their toolbars, and the various interface options.
1.5 Operational Mode Tabs & Toolbars
GI.bench has two operational mode tabs, Project Settings and Data Acquisition. They are selectable within GI.bench above the toolbar. The options available within the toolbar change depending on the interface tab the user is currently on.

1.5.1 Project Settings Tab
The Project Settings tab is for configuring projects and DAQ devices. The following describes the various buttons available on the Configuration tab toolbar.

-
New: Create a new project
-
Open: Open an existing project from PC
- Save: Save the current project to project file on PC
- Read:
- Read project configuration from online controller(s)
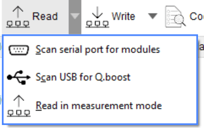
- Scan serial bus for measurement modules
- Scan USB port for Q.boost modules
- UART 5 feature - read configuration without affecting acquisition
- Read project configuration from online controller(s)
- Write:
- Write current project configuration to online controller(s)
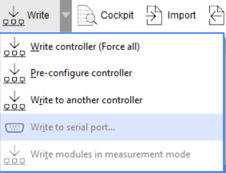
- Preconfigure controller
- Write to another controller: write project made from one DAQ system to a different one with matching hardware
- Write to modules connected over serial bus
- UART 5 feature - Write to modules in measurement mode: write module changes without affecting acquisition
- Write current project configuration to online controller(s)
- Cockpit: Open cockpit for access to project dashboard, project state, measurement records, tools, admin (if user management enabled), and help documentation
- Import:
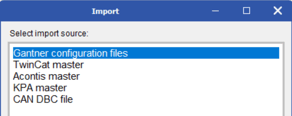
- Import module configuration files (.gcf)
- Import configuration of EtherCAT modules from TwinCAT master
- Import configuration of EtherCAT modules from Acontis master
- Import configuration of EtherCAT modules from KPA master
- Import CAN dbc file for automatic creation of CAN remote input variables
- Export:
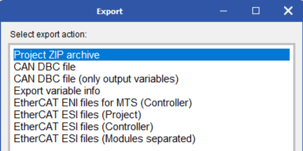
- Export copy of GI.bench project as a zip file
- Create CAN dbc file with variable information (only for variables selected on CAN bus)
- Create CAN dbc file with variable information (only for output direction variables selected on CAN bus)
- Create CSV file with variable information
- Create EtherCAT Network Information file (ENI)
- Create ESI files for project level
- Create ESI file for Q.station with EtherCAT
- Create ESI modules for EtherCAT modules
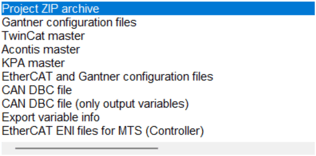
- Export/write configuration of Q.station with EtherCAT modules using TwinCAT, Acontis, or KPA master
- Show actual errors: Get more information on configuration errors. Only visible if error in project
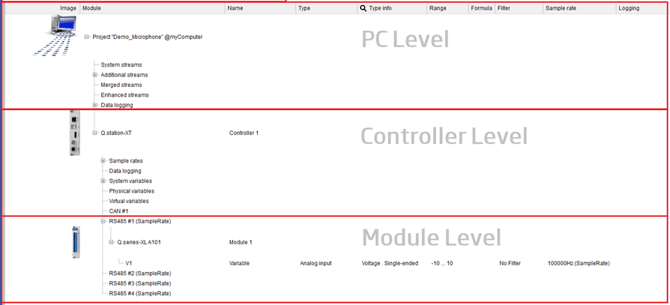
In the Project Settings tab, there are three levels where you can make configuration changes to a project: the PC or project level, the controller level, and the module level. You can observe these levels in the general structure of the project configuration tree. The configuration processes for these levels are detailed in Chapter 3 of this guide.
1.5.2 Data Acquisition Tab
The Data Acquisition tab is for viewing measurement channels, groups, charts, loggers, and managing data loggers. The following graphic describes the various buttons available on the Data Acquisition tab toolbar.

- Channels: view live values of measurement channels in current project
- Groups: view user defined groups of channels
- Quickview: preview selected channels in a Y-T graph
- Dashboard: Open project dashboard (tied to GI.bench project file)
- Cockpit: Access to project dashboard, project state, measurement records, tools, admin (if user management enabled), and help documentation
- Controller dashboard: Open controller dashboard (resides in controller)
- Records: view info of imported logged files
- Acquisition: start/stop live acquisition
- Logger: manually start/stop project level data loggers
1.6 Additional Interface Options
There are some additional tools and shortcuts on the bottom-left of the software
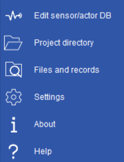
- Edit sensor/actor DB: Add, copy, and remove user defined sensors/actors to/from the database
- Project directory: Opens default GI.bench directory where projects are stored
- Files and records: Opens default GI.bench directory where logged files are stored
- Settings: Edit GI.bench software settings and GI.service connection details
- About: GI.bench software version info, changelog, and license info
- Help: Open GI.documentation page for detailed software information
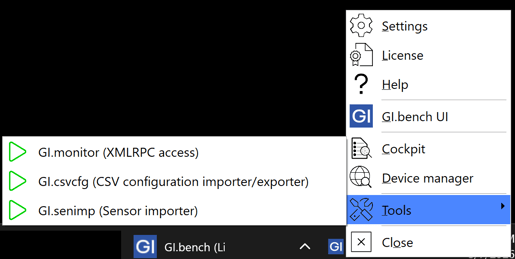
1.1 GI.bench System Tray Icon
The GI.bench system tray icon can be right-clicked for additional tools & settings, including the online manual (Help), GI.cloud device pairing, web visualization, and CSV configuration imports and exports for large systems.
2. GI.bench Software Installation
The firmware version(s) of the controller(s) must be updated to match the version of GI.bench. You can request the latest test controller firmware and GI.bench software version(s) from Gantner’s technical support. Failure to keep firmware and software updated to the latest versions can sometimes cause disturbances during operation via communication failures. See Chapter 9.0 of this guide for the controller firmware update process.
Regional Technical Support: https://www.gantner-instruments.com/resources/support/
2.1 GI.bench Install Process
We recommend closing all open programs before installing GI.bench. Administrator rights are required.
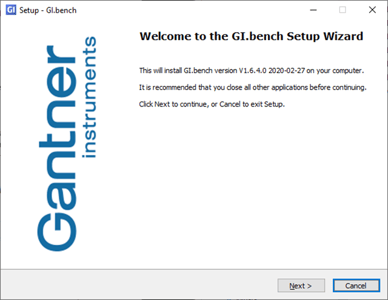
- Locate the GI.bench Setup executable and double-click it to start the installation process. If there are admin privilege issues, right-click the .exe and click Run as administrator.
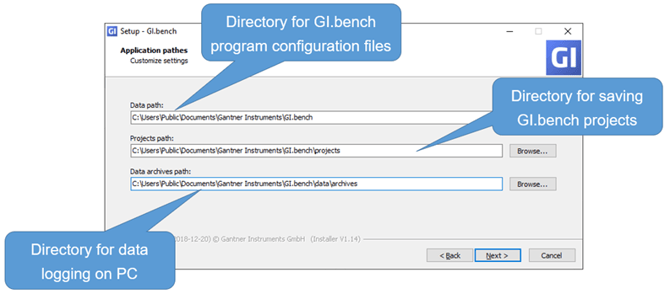
- You may change the following default directories during installation if desired.
- After the installation process has been completed, double-click the GI Bench icon on the desktop, system tray icon, or from the installation directory.

2.2 Firewall Exceptions
Before connecting Gantner hardware to GI.bench, make sure to provide proper exceptions in the firewall for all the Gantner Instruments software tools.
Below is a comprehensive list of GI.bench sub-applications that you must add as firewall exceptions:
- apps – GI.bench sub-application
- com – GI.bench sub-application
- config – GI.bench sub-application
- data – GI.bench sub-application
- monitor – GI.bench sub-application
- service – GI.bench sub-application
- system – GI.bench sub-application
- TwincatFoE
- Gibenchui
- GInsKpaFoE
2.3 GI.bench License
A trial GI.bench license is free and provides the user with the ability to configure and visualize data streams using only one test controller. Additional data streams from devices, whether standard, merged, or enhanced, are not included in the trial version of GI.bench.
A full GI.bench license can be purchased as either a USB dongle or ticket-ID. If a ticket-ID is purchased, it can be requested from the user’s PC after starting the software. GI.bench ticket-ID licenses are bound to the PC that requests the license. The license is valid for either OS version (32-bit or 64-bit) and future versions of GI Bench. If the hardware of the PC changes, then a new license must be requested. Contact your local Gantner Instruments Sales & Service location for purchasing details.
3. System Configuration
3.1 Renaming a Project
Double-click on the PC element at the top of the project tree to rename the project before saving it.
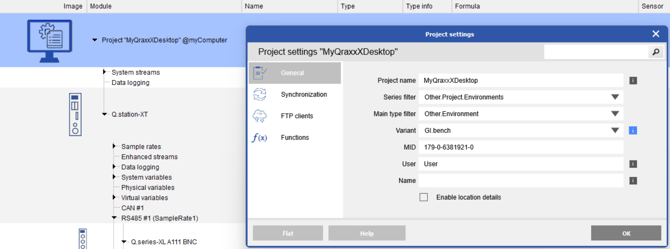
Default project directory: C:\Users\Public\Documents\Gantner Instruments\GI.bench\projects
3.2 Scan for Connected Controllers
- A controller should be connected directly to or exist within the same Ethernet network as the PC/GI.bench. Verify that Internet Protocol v6 (IPv6) is activated.
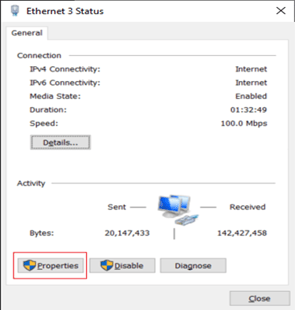
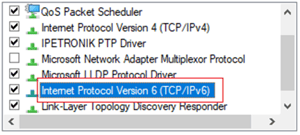
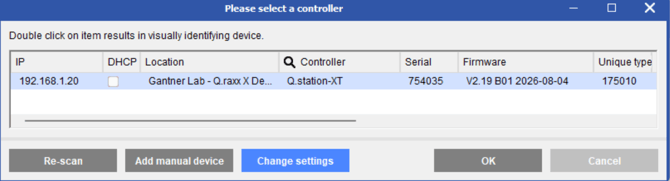
- If a GI.bench license is activated, GI.bench opens with a blank (new) project. Click Read in the toolbar to scan your network for a connected Q.station controller.

- Click Re-scan if the controller was not initially detected. You can also manually enter the IP address of the controller by clicking Enter manually. Once discovered, select the controller and click OK.
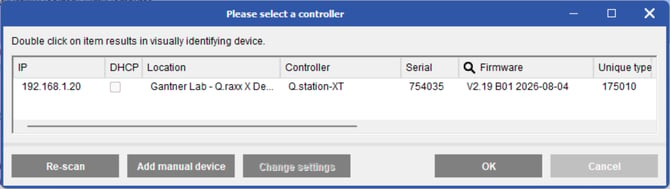
- If the controller appears in blue, it is not on the same network as the PC. Highlight it and select Change Settings to enter an IP address that is on the same network.
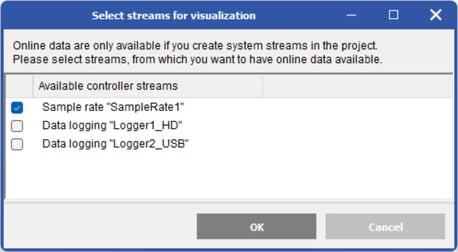
- When reading a controller, GI.bench prompts you to select data streams for visualization. Depending on the stream, some channels may or may not be available for visualization. Any existing controller loggers can be added as data streams
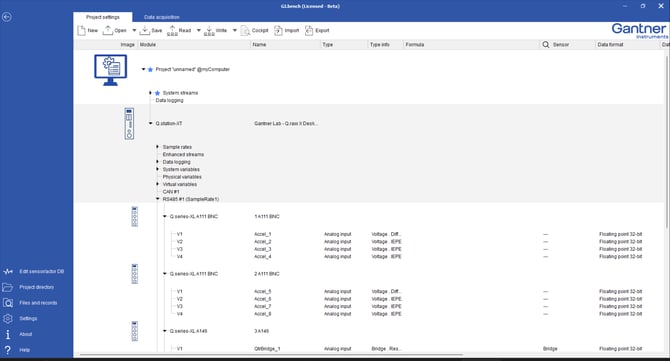
- GI.bench populates the project configuration tree automatically after reading the controller.
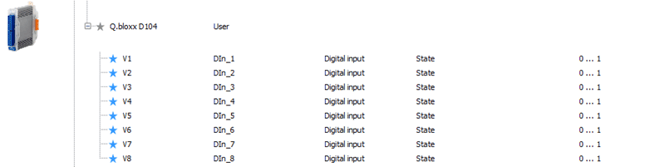
- Blue stars in the project tree next to controllers, modules, or variables indicate that there are changes that do not exist yet on the controller. Click Write to export the configuration changes.

3.3 Device Specification Category Selection
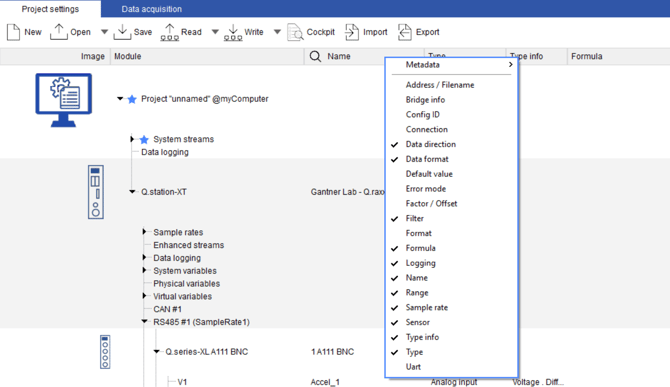
After reading a Q.station controller into GI.bench, the connected I/O modules are displayed under the controller in the project tree. Various specifications for each device are visible and organized in columns within the project tree. You may select which specification categories are visible within the project tree.
- Right-click on the blue header of the project tree to open the specification selection context menu.
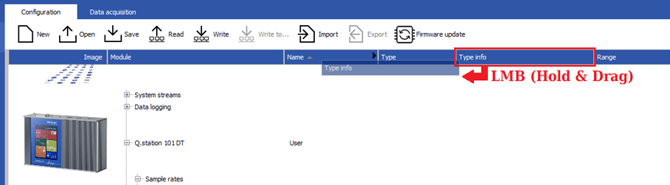
- Change the order of the columns by clicking (hold) and dragging them to the desired locations.
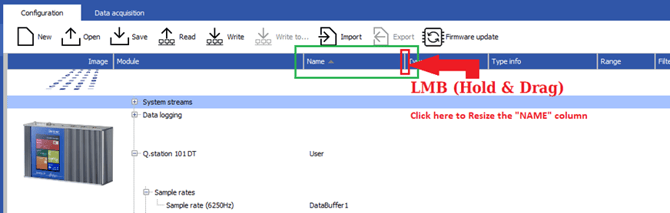
- Resize a column by clicking (hold) and dragging the column separator on the right side of the target column to either the left to shrink or right to expand.
3.4 Configuring a Controller
Double-click (or right-click > Edit > Edit controller) on a controller in the project tree to open the Controller settings window.
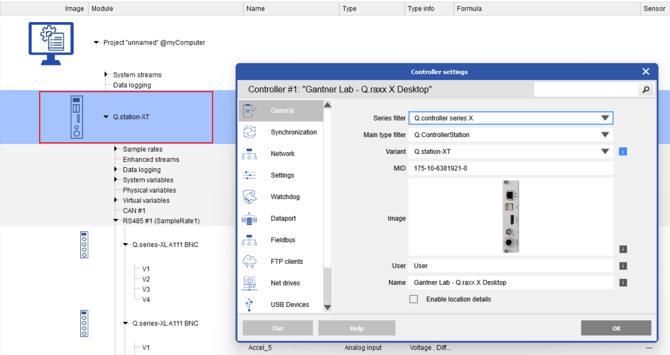
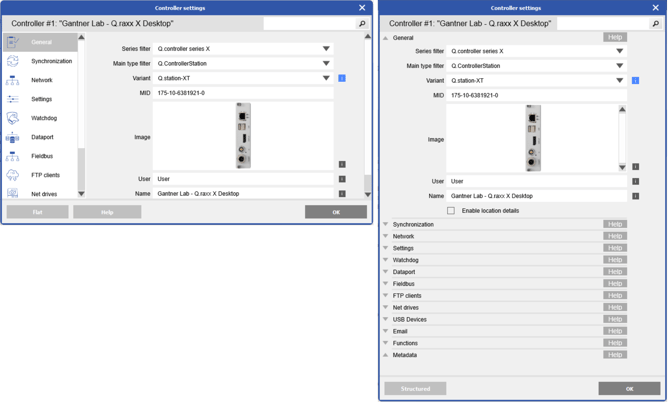
In the Controller settings window are the various configurable settings of the (Q.station) test controller. You may toggle between the Flat or Structured layouts. Click OK after making any changes to settings.
3.4.1. Controller Name
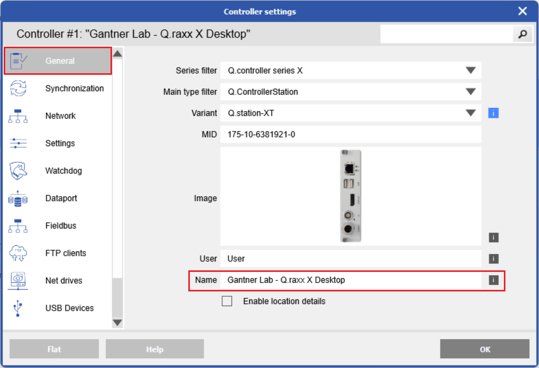
Change the name of the controller in the Controller settings window under General > Location.
3.4.2 Activate Controller Plugins
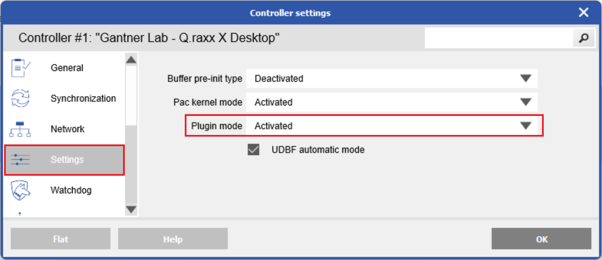
Go to Settings > Plugin mode to activate/deactivate custom (Q.station) controller plugins. Controller plugins can provide additional “custom” functionality but are not available by default. Contact your local Gantner Instruments Sales & Service location for additional details regarding Q.station controller plugins.
3.4.3. System Sample and CPU Calculation Rates
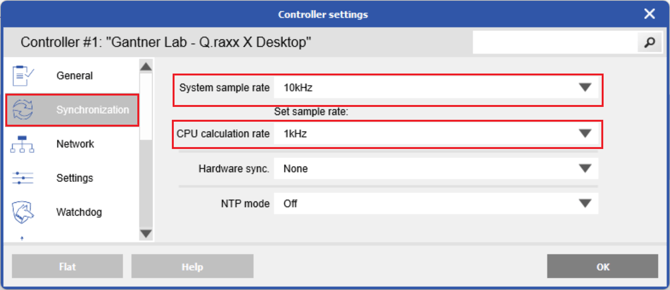
Go to the Synchronization tab to configure the controller’s System sample rate and CPU calculation rate.
Hardware sync: Set up an external synchronization method by selecting the relevant protocol from the drop-down menu, e.g., AFNOR, IRIG-B, or Q.sync over RS485. Select Q.sync over RS485 if the Q.station controller is a slave to another Q.station (master) controller.
System sample rate: Set the maximum possible sample frequency of the Q.station controller. Each data buffer of the controller can be assigned a sample rate divisor of the System sample rate.
CPU calculation rate: The controller CPU’s cycle frequency for handling virtual variables and arithmetic.
NTP mode: The controller can be synced to a time server for continuous internal clock synchronization by selecting the relevant mode (i.e., Standard or Legacy NTP), entering the IP address of the NTP server (local network or internet), and adjusting the Timezone offset from the server.
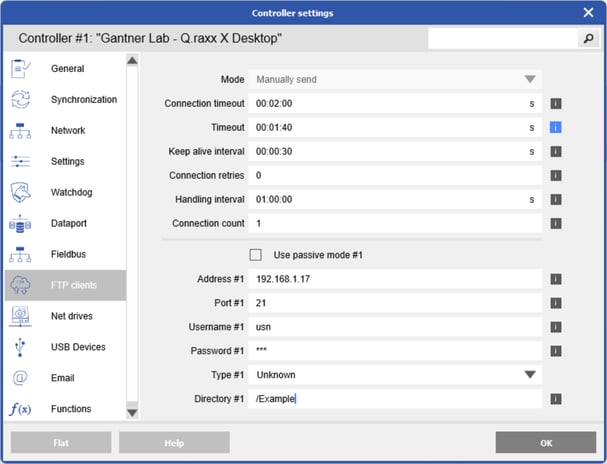
3.4.4 Send Data to FTP
Go to the FTP clients tab to configure the controller to send logged files to an FTP server.
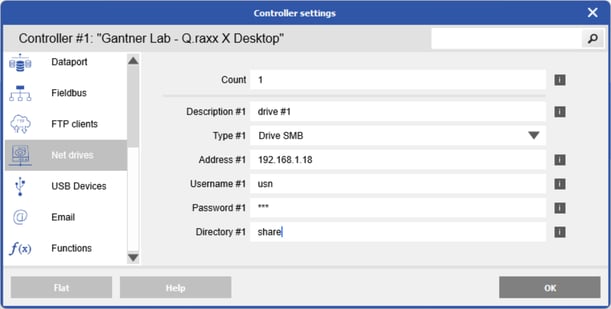
3.4.5 Send Data to Network Drive
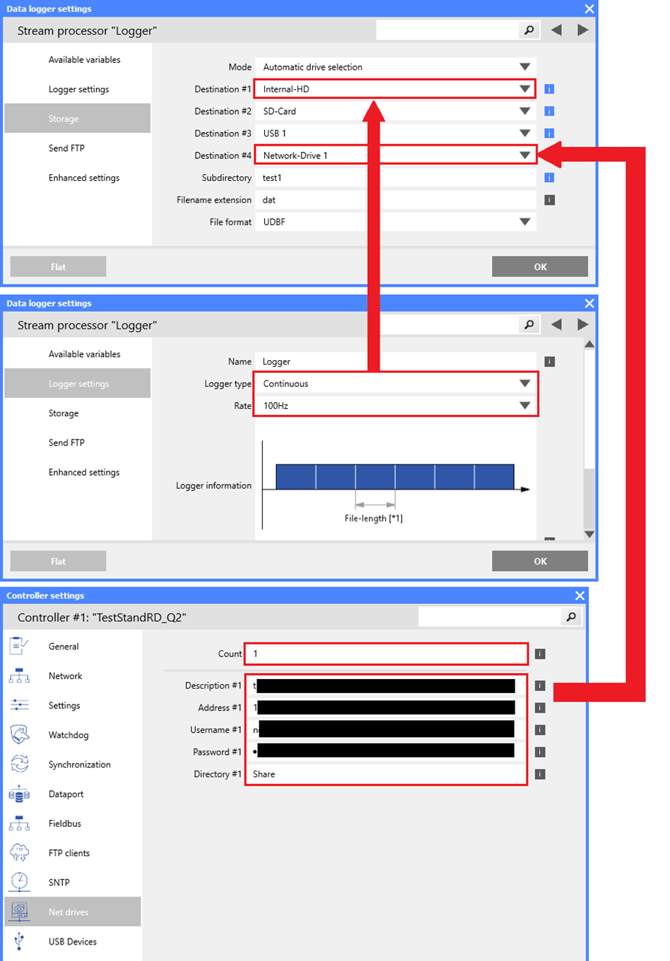
Go to the Net drives tab to add network drive destinations for storing logged files (see Chapter 5: Logging).
3.4.6 Write Configuration Changes to the Controller
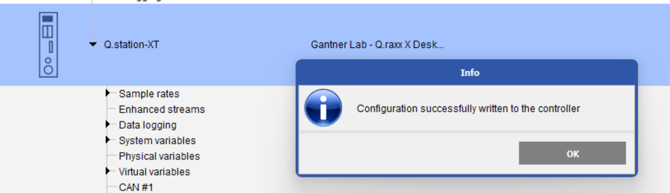
If any unsaved configuration changes exist in a project, i.e., whether to the controller or measurement channels of the slave modules, then those elements are marked with a blue star icon in the project tree. To save these changes to the hardware, click the Write button in the toolbar in the configuration tab.
GI.bench notifies the user when the project has been successfully written to the controller. After the writing process, there should not be any blue star icon in the project tree.
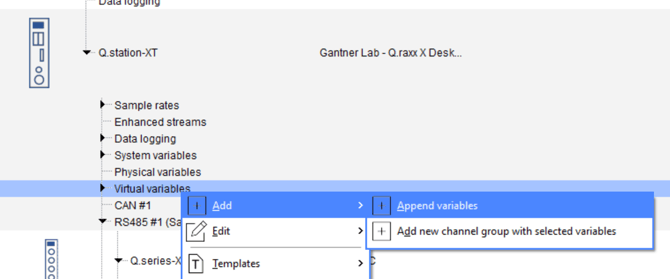
3.4.7 Adding System and Virtual Variables
To add additional system or virtual variables, right-click the Virtual variables section > Add > Append variables. Double-click on the newly created variable to open the Variables settings window.
3.4.8 Configuration Error Information
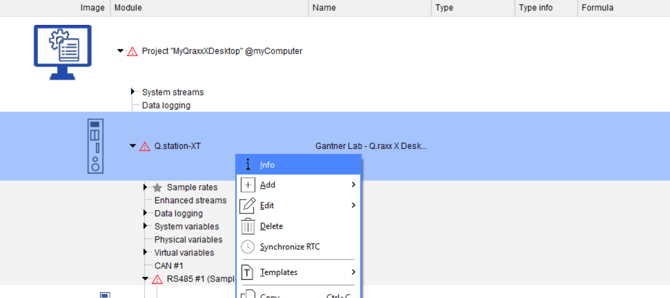
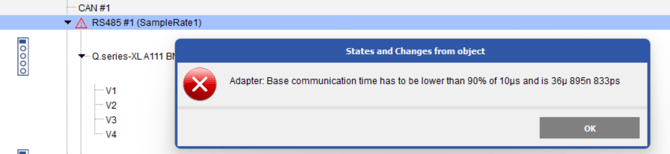
If a configuration error exists on the controller or modules, the icon appears next to the affected element(s). Right-click on the element(s) that have the icon and select Info for more information.
In this example, the error is in the RS485 line. The sample rate is too high for the number of channels in the UART/RS485 line.
3.4.9 Sample Rate and Data Buffer Size
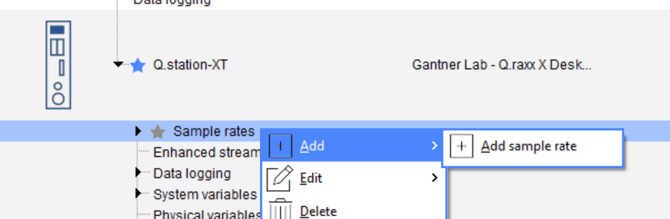
You may configure up to 4 individual Sample rates (buffers) on a Q.station test controller.
- Right-click on the Sample rates section > Add > Add sample rate
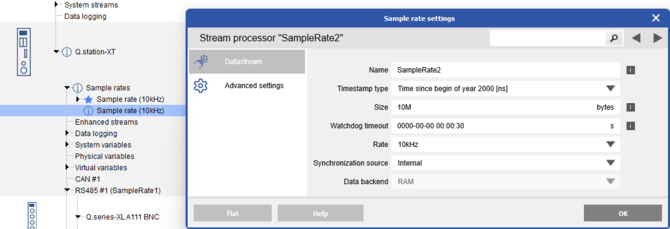
- The 1st sample rate is only configurable in the controller settings window. Subsequent sample rates are configured by Double-clicking on a sample rate in the project window to change the settings of the buffer such as Name, Size, and Rate
3.4.10 Controller Variable Types
The Q.station controller provides configurable System, Physical (digital inputs), and Virtual variable types.
- Right-click either the System, Physical, or Virtual variables element > Add > Append variables
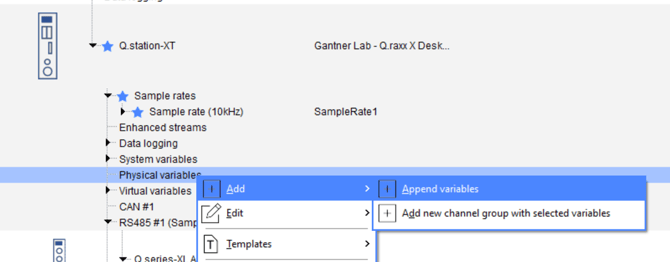
- Double-click on the new variable to open the Variable settings window and configure as necessary
- Select the controller in the project tree and click Write in the toolbar to save the changes to it

3.5 Slave Module Configuration
Double-click on a module within the project tree in GI.bench to open the Module settings window. You may toggle between the Flat or Structured layouts. Click OK after making any changes to settings.
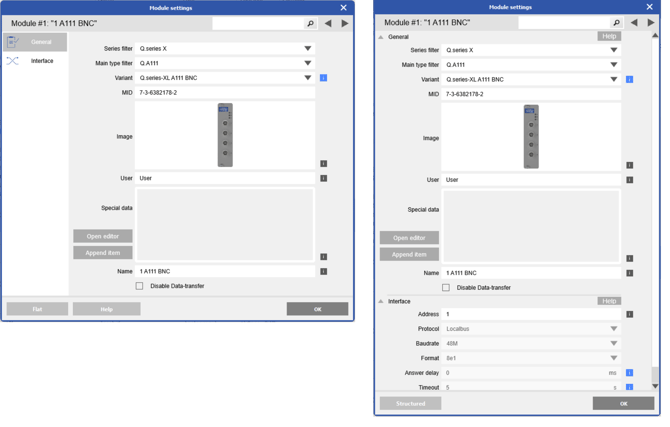
3.5.1. Module Addressing
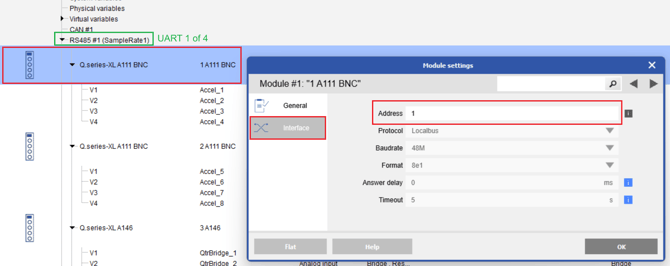
If the addresses of the modules are not configured via the socket DIP switches, then they must be set in the GI.bench software. For each UART of a Q.station controller, start from address 1 (up to 16 maximum).
3.5.2 Configuring Variables
- To make configuration changes to specific channels, double-click on the desired variable or right-click > Edit> Edit variable
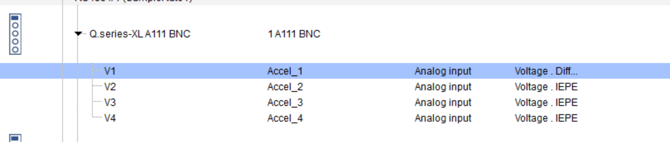
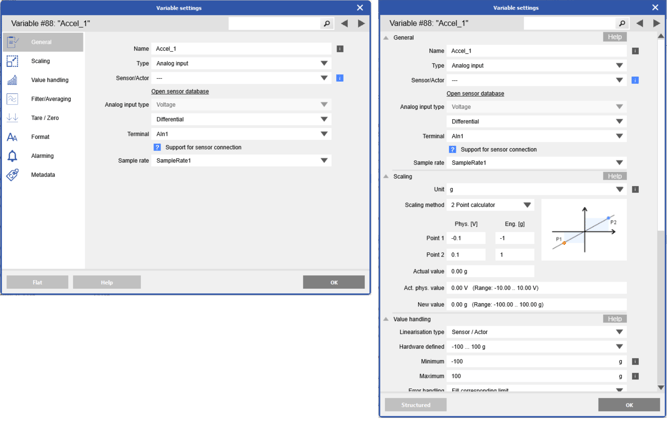
- In the Variable Settings window, there are General, Scaling, Value handling, Filtering, Averaging, Tare, Zero, and Format You may use the arrows at the top right to scroll through variables from within the same window. You may also toggle between the Flat or Structured button layouts. Click OK after making any changes to settings.
- Select the controller in the project tree and click Write in the toolbar to save the changes to it
3.5.3 Variable General Settings
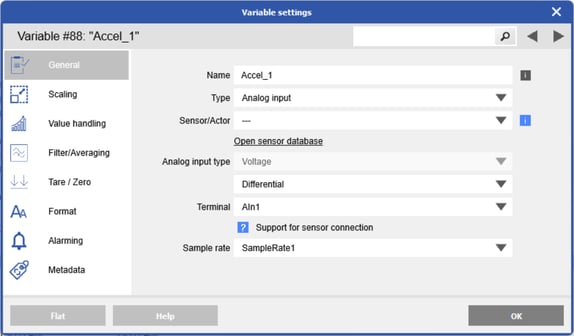
Click on the “i” icons for more information. For regular use, configure the following fields, as shown above:
Name: The variable name used in data logging and visualization
Typ: Set variable as Analog Input, Arithmetic, Digital Output, Digital Input, Setpoint, Alarm, Analog Output
Terminal: The physical input of the measurement module where the associated sensor is attached
Sample rate: Select a pre-configured data buffer from the drop-down list to assign the variable to it.
3.5.4 Variable Unit/Scaling Settings
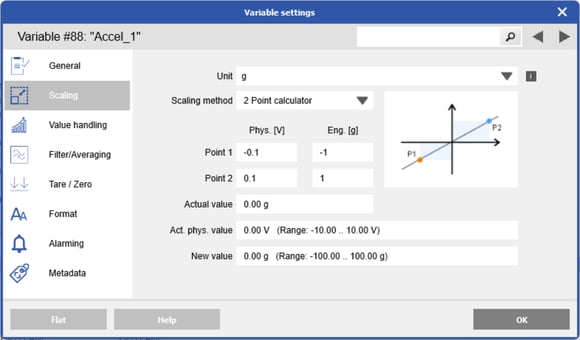
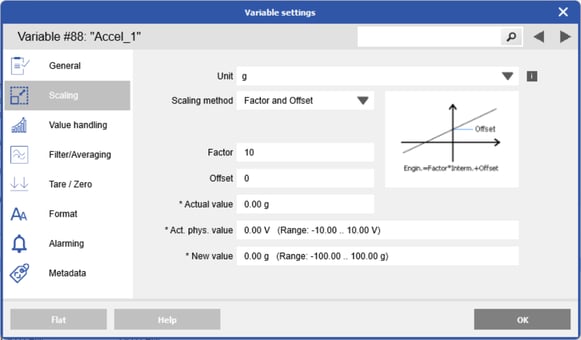
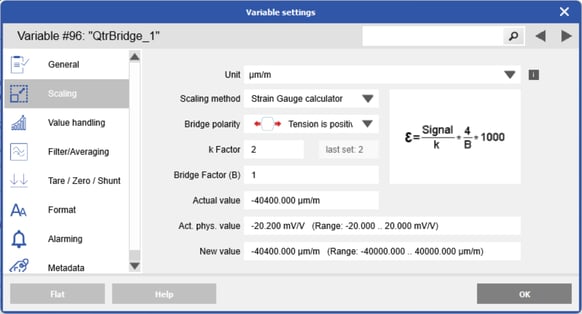
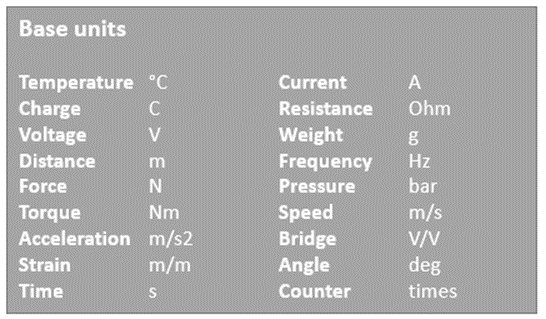
Unit: Unit of measurement, used in logger files and data visualization. Select units from the drop-down list.
Custom Units: Type in the desired base unit and apply a Factor and Offset or 2 Point calculator calibration
Scaling method: Choose Factor and Offset, 2 Point calculator, or Strain Gauge calculator (Bridges only)
3.5.5 Variable Value Handling Settings
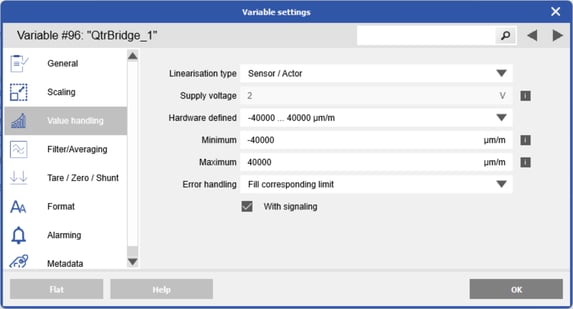
Hardware defined: Select from the available hardware-defined input ranges (units defined in Scaling)
Min/Max: Minimum and maximum permissible input range (limit); you may edit these values if necessary
Startup/Default value: User-defined default value for variable (default: 0)
Error Handling: Define variable behavior when the value reaches the input range (min/max) limits
3.5.6 Variable Filter/Averaging Settings
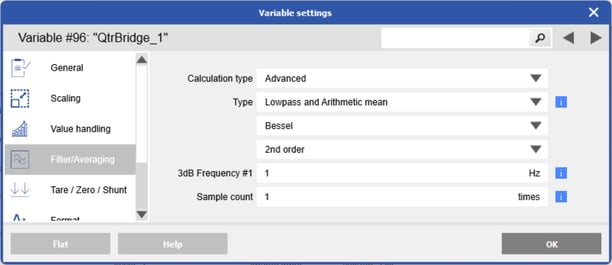
(Filter) Type: Arithmetic mean (average), low-pass, high-pass, band-pass, band-stop, Bessel or Butterworth at 2nd, 4th, 6th, 8th orders selectable with Advanced Calculation type selected.
3db frequency point: The cut-off frequency for digital filters defined in Hz
Sample Count: Quantity of measurements (times) used for averaging. If the value entered is 0, then the software will auto determine the optimum number of points based on the configured sample rate.
3.5.7 Variable Zero/Tare/Shunt Settings
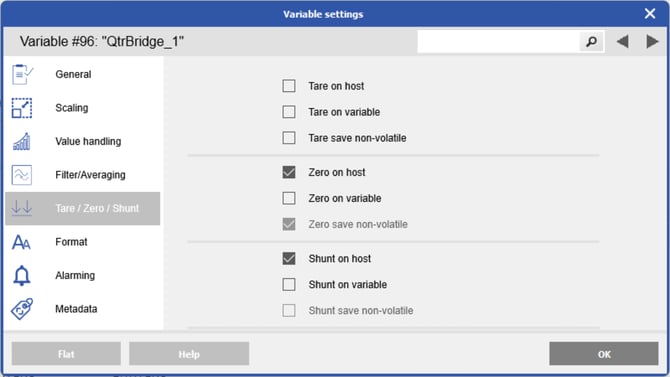
Tare: Nulling the measurement with a single sample. The tare value only saves if Tare save non-volatile is selected.
Zero: Nulling the measurement with an average of multiple samples. The zero value saves to the module.
Shunt: Activate internal (e.g., 100kOhm) Shunt resistor (if available, e.g., A106)
Tare/Zero/Shunt on host: Allows use of commands in the Channel & Group view in Data Acquisition tab.
Tare/Zero/Shunt on variable/digital input: Using an external signal to trigger zero or tare; trigger occurs when the signal > 0.5.
3.5.8 Multi-variable Configuration Changes
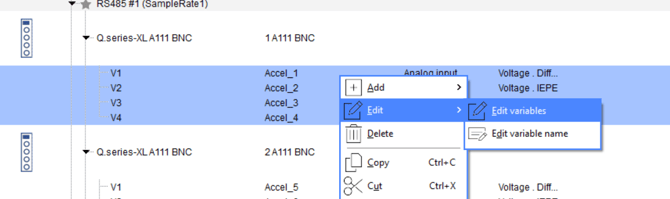
- It is possible to make configuration changes to multiple variables simultaneously. Hold Ctrl while selecting the variables to be configured. You can select variables from multiple modules at once.
- Right-click the variables > Edit > Edit variables
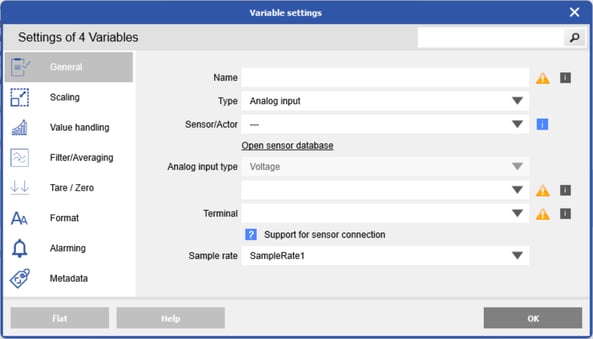
- The Variable Settings window displays how many channels are being configured at the top-left, and settings that differ between variables are marked with a yellow warning icon.
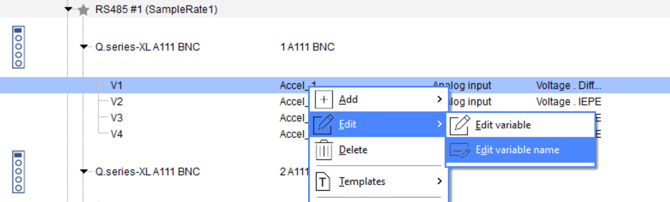
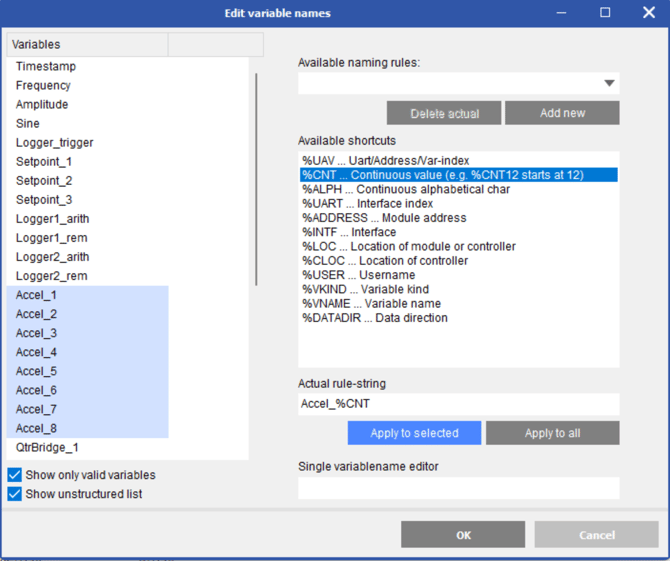
3.5.9 Quickly Edit Multiple Variable Names
You can edit multiple variable names simultaneously by using the Edit variable names interface.
- Right-click on any variable and select Edit varnames in the context menu
- Select multiple variables from the list by holding the Ctrl With multiple variables selected, you may edit their names in the Actual rule-string field by typing in the desired text and combine with the commands in the Available shortcuts field. Click Apply to selected after defining a rule-string. To edit a single variable, select it from the list and edit the name in the Single variablename editor.
3.5.10 Sensor/Variable Calibration
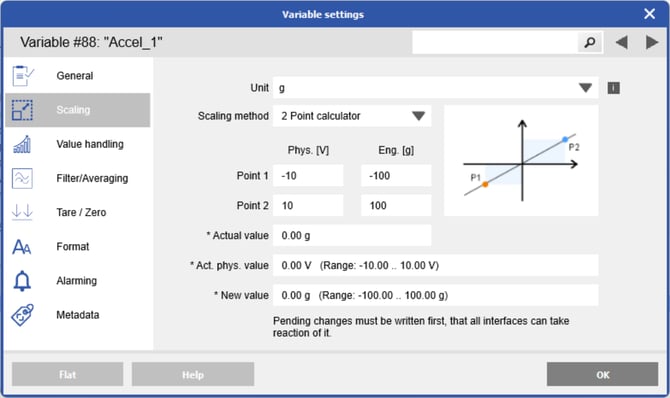
The following is an example of accelerometer calibration using the specifications provided with the sensor. This process is the same for most sensor types.
In this example, the accelerometer sensor possesses a sensitivity of 100mV/g.
| Input [V] | Output [g] |
| - 10 V | - 100 g (- 981 m 7 s2) |
| 10 V | 100 g (981 m 7 s2) |
- In the Variable settings window, under Scaling, ensure 2 Point calculator is the Scaling method
- In the Unit field, manually type in “g” replacing the previous unit
- Enter the fields Point 1 and Point 2 per the sensor’s specifications, then click OK when finished
- To save the changes, select the controller in the project tree and click Write in the toolbar
4. Data Streams
4.1 System Data Streams
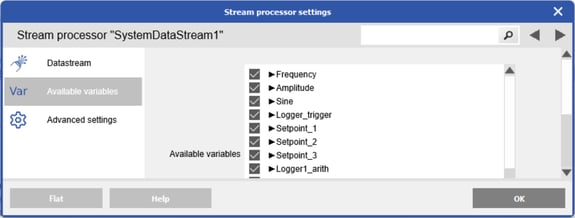
With GI.bench, data logging and visualization are possible on the PC level (in addition to Q.station loggers). To do this, you must first create the necessary data streams for each controller buffer containing the desired data. Data loggers and charts within GI.bench pull data from System streams or Merged streams.
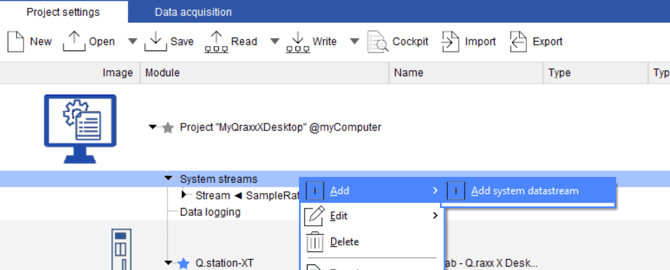
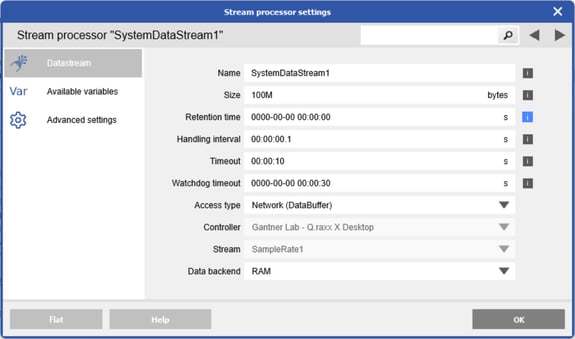
Name: Name of the system data stream
Controller: Select the controller that contains the desired data (buffer)
Stream: Select the controller buffer from which to create a system data stream
Available Variables: In this menu tab, select the desired variables to be included in the stream
4.2 Merged Data Streams
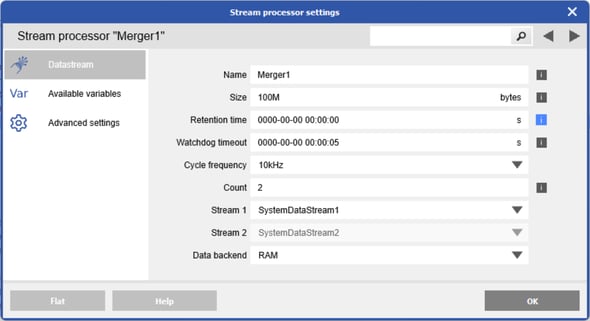
If multiple system data streams exist within a project, they can be combined into a single merged data stream if desired. GI.data collects all data from the buffers of the controller(s) and merges their data into one merged data stream. Data loggers and visualization charts can pull their data from a merged stream.
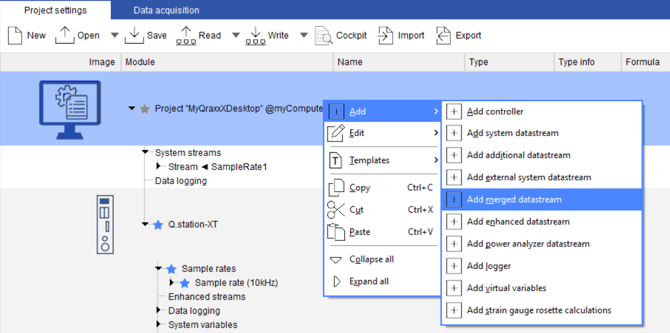
Click on the “i” icons for more information. For regular use, configure the following fields, as shown below:
Name: Name of the merged data stream
Cycle frequency: Sample frequency of the merged data stream (only divisors of the Streams 1..n)
Count: Define the quantity (n) of system data streams to be included in the merged data stream
Stream 1, 2, … n: Select each of the (preconfigured) system data streams to include in the merger
Available Variables: In this menu tab, select the desired measurement variables from Streams 1..n
4.3 Enhanced Data Streams
Enhanced data streams allow for the creation of arithmetic functions (statistical variables) for processing data on the stream. Enhanced streams can be used for logging and visualization purposes, and they can exist on the PC and controller levels of the GI.bench project tree. Enhanced streams can be used in parallel with System streams and Merged streams, and can be configured with different data rates if necessary.
TIP: You may create and define as many enhanced data streams as necessary; Gantner suggests creating several Enhanced data streams to capture data at different rates instead of adding additional data buffers (sample rates) to the Q.station. Doing so reduces the performance required by GI.bench and the Q.station.
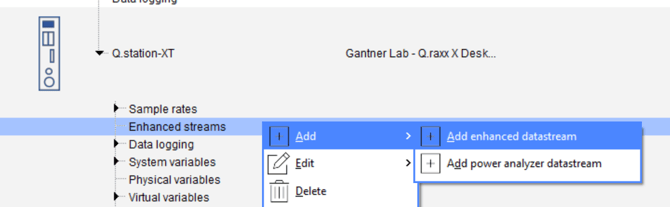
- Right-click the Q.station controller or the enhanced stream section in the project tree > Add > Add enhanced datastream
- Double-click the Data process under the project tree element, Enhanced streams, to configure it
- Define a Name and select the Source (buffer) and Rate (cycle frequency) of the Enhanced stream
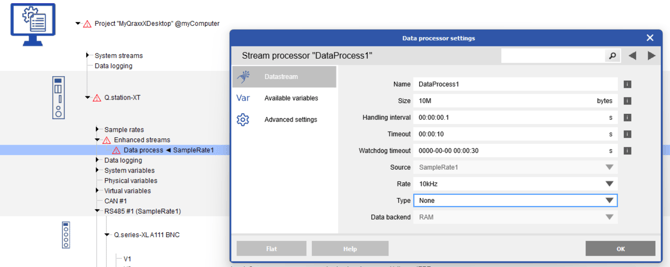
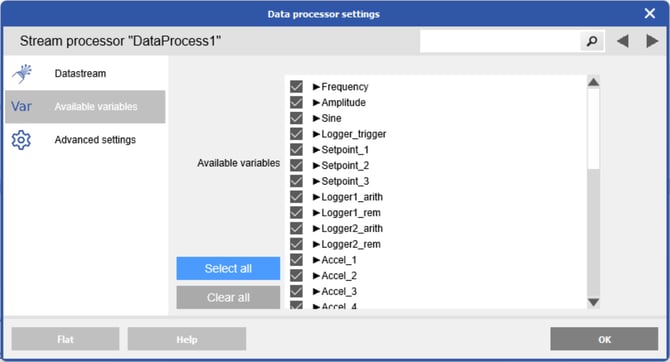
- In the Available variables section, select the Variables you wish to perform calculations on or include
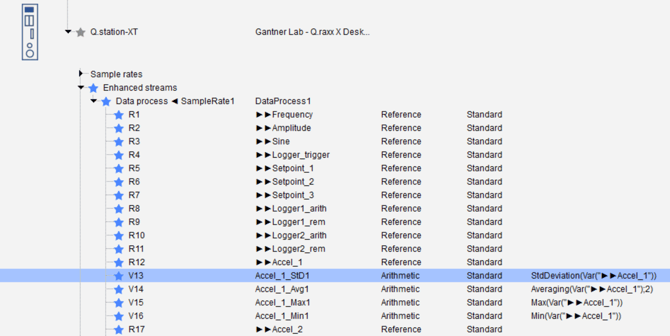
4.4 Statistical Variables (Enhanced Data Streams)
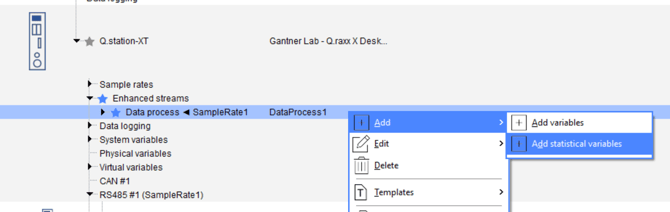
Once the enhanced data stream is configured, you may add additional arithmetic variables for statistical analysis (e.g., min, max, standard deviation) to the stream.
- Right-click the Data process under the Enhanced streams element and select Add variables
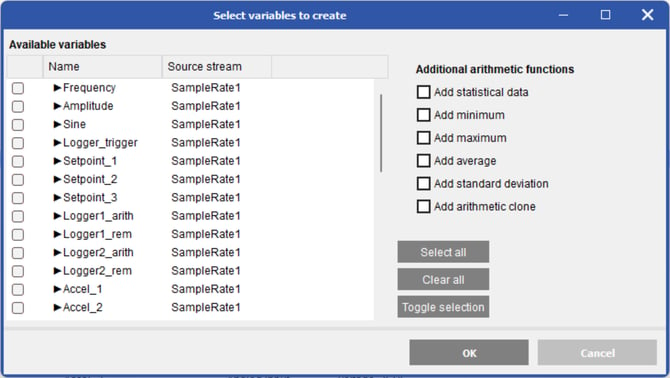
- Select Variables to include in the stream and define the desired Additional arithmetic functions. Selecting Add statistical data will perform all four calculations (Min, Max, Average, and Std Dev).
- Double-click an arithmetic variable in the project tree to open the Variable settings
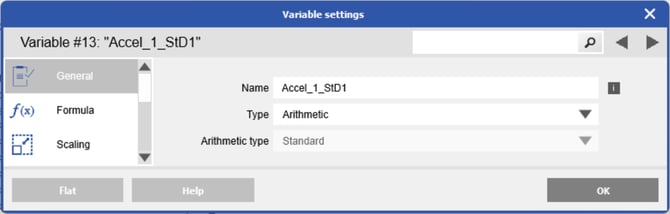
- In the General tab, you may change the Name of the variable.
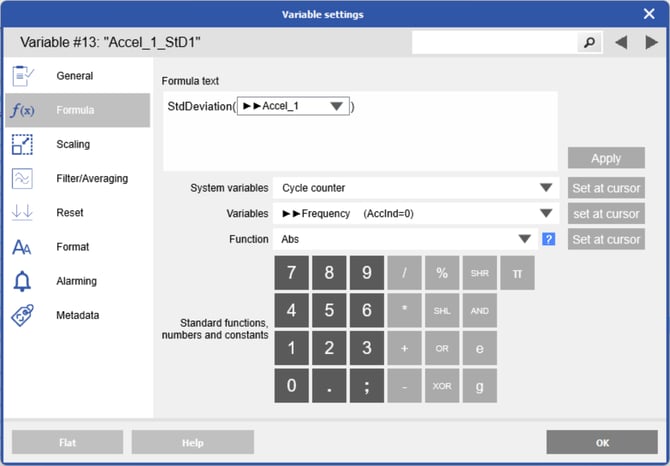
- In the Formula tab, you may view or edit the Formula text of the Arithmetic variable. The Formula text is limited to 1000 characters. You may insert an arithmetic function into the formula text from the Functions drop-down menu by selecting the desired function and clicking Set at cursor. Click the small “i” button next to the Functions drop-down menu to view the relevant formula syntax.
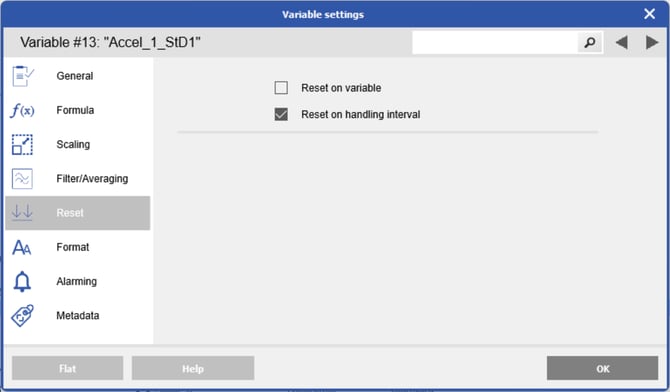
- In the Reset tab, select Reset on logging interval to reset the calculated Min, Max, or Average on every logging interval (e.g. 1 min). Reset on variable utilizes an external variable to trigger a reset.
5. Data Loggers
Q.station controllers have 20 configurable data loggers that function independently of a PC. Data loggers can also be configured on the PC level within GI.bench but require a System stream or Merged stream.
5.1 Creating Data Loggers
- To create a data logger, right-click tne data logging section under either the PC or Controller level > Add > Add logger
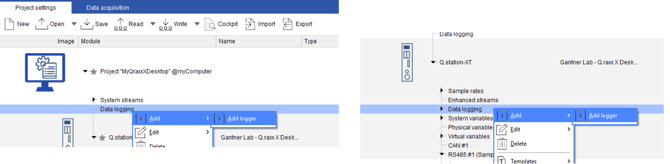
- Double-click on the newly created logger, under either the PC or controller Data logging element
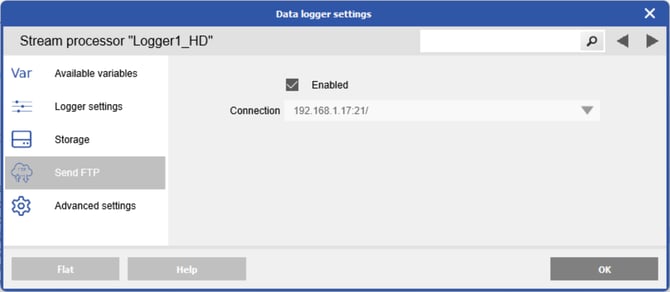
- In the Data logger settings window, select the Data source and Variables, then define the logger’s Name, Type, Rate, File length, Storage destination(s), Send FTP connection, and Enhanced settings. The Send FTP functionality is only available for controller-level data loggers (not on the PC level).
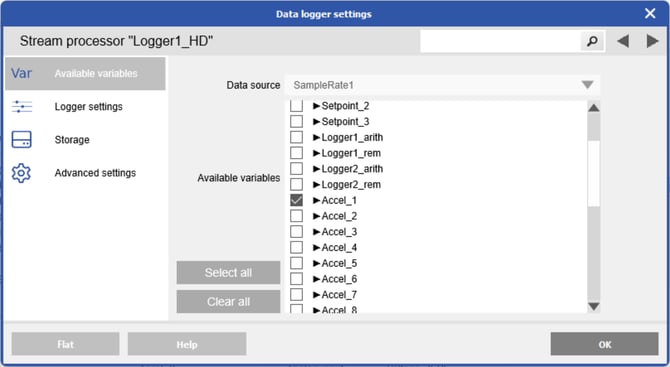
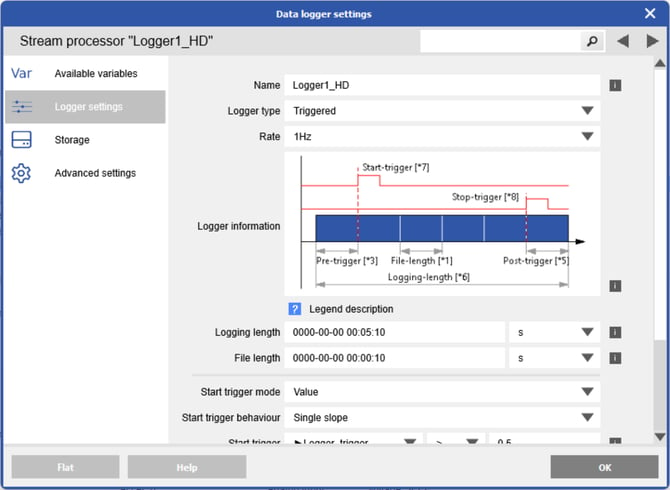
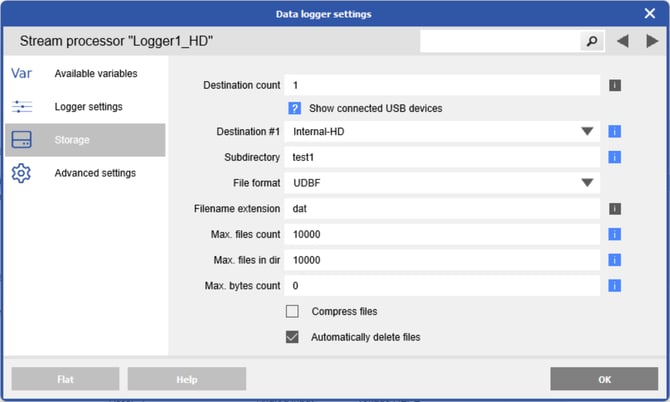
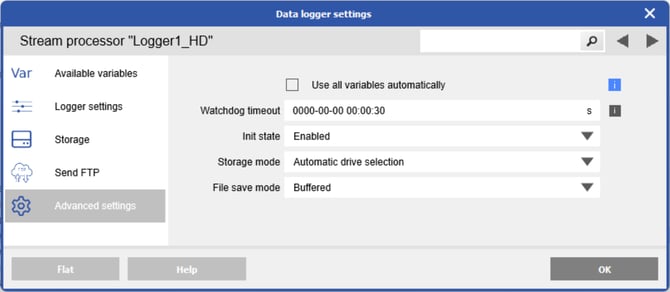
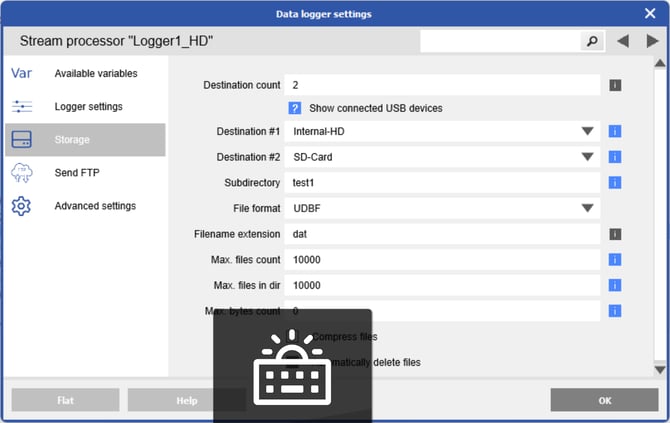
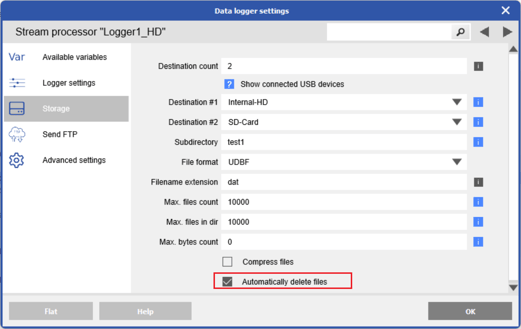
- In the Storage settings tab, you may configure up to 4 destinations per data logger. To add more storage destination fields, change the Destination count field in the Enhanced settings
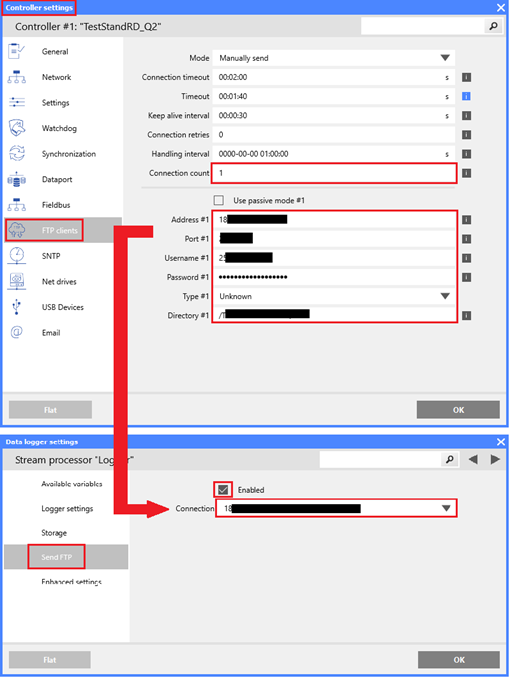
- In the Send FTP logger settings tab, to select the FTP connection, you must first configure the FTP clients tab in the Controller settings Once configured, the FTP connection is selectable.
- In the Storage tab, select Automatically delete files to delete files when a destination reaches the configured files or bytes limits or full capacity.
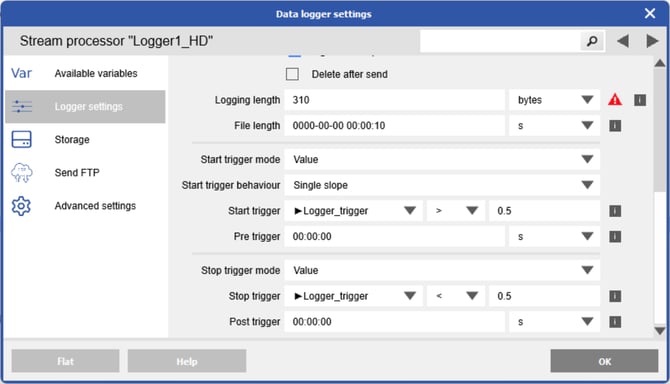
- For Triggered and Event based loggers, you must configure the trigger variable(s), the relational operator(s), and trigger value(s) in the Trigger. Triggered loggers can have a Start/Stop trigger, as well as Pre/Post triggers, specified in seconds or data sets (samples). Event based loggers have an Event (or Start) trigger and an optional Pre trigger specified in seconds or data sets (samples).
- To save the changes, select the controller in the project tree and click Write in the toolbar.

5.2 Logger Settings
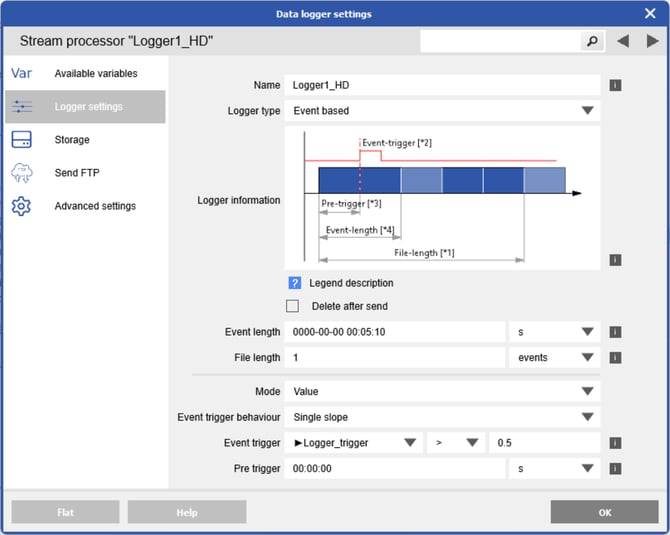
Name: Define the name of the data logger, which appears in the name of logged files
Logger type: Choose whether the logger is Continuous, Triggered, or Event based
- Continuous logging initiates as soon as the project is activated and continues until its deactivated.
- Triggered logging utilizes start/stop triggers, and pre/post trigger logging is available but optional.
- Event-based logging uses a single trigger (or Event) with pre-trigger logging available but optional.
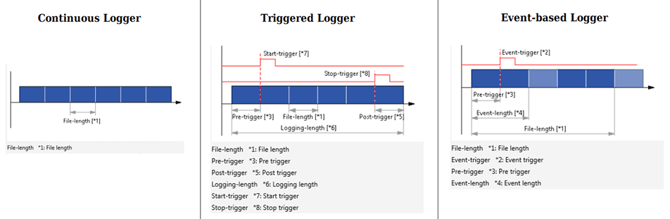
Logger rate: Select a logging rate, only available for Continuous or Triggered loggers. The max. logging rate available is determined by the configured System sample rate available in Controller settings.
File length: Define the max length of a data file specified in data sets (samples), seconds, bytes, or events. When the defined File length is reached, a new logger file is created as long as logging continues.
Logging length: Define the maximum limit of the logger specified in data sets (samples), seconds, or bytes. When the Logging length is reached, data logging STOPS until the logger is triggered again. The value of File length cannot exceed the value of the Logging length for the Triggered logger type.
Event length: Define the maximum limit of an “event” specified in data sets (samples), seconds, or bytes. Logging continues as long as subsequent events occur within the defined Event length. Multiple events can be stored in a single data file by changing the number of events in the File length field.
5.3 Storage Settings
5.3.1 PC Level Logger Storage Destinations
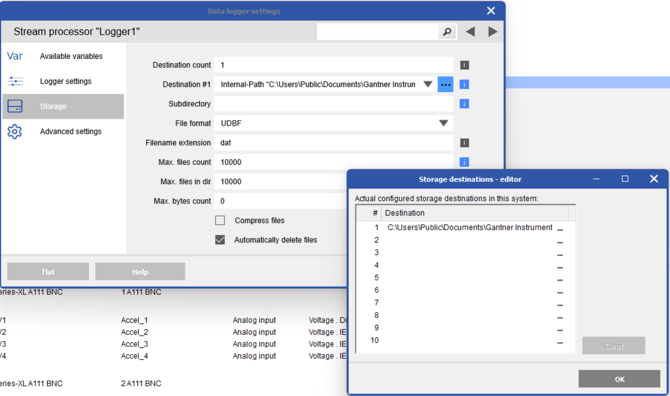
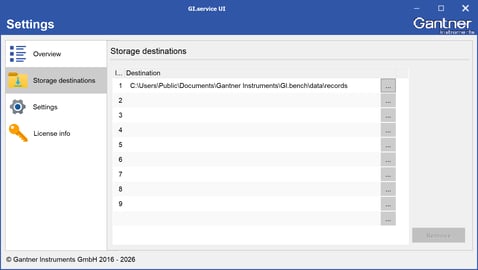
Destination: Data loggers on the PC level log to internal paths on the PC. Configure up to 10 Internal Path storage destinations within the GI.service settings. Right-click the GI icon in the Windows System Tray and select Settings in the context menu. Go to the Storage Destinations tab and edit an available Index (0-9). Once an Index is defined in GI.service, that Internal Path is selectable in the logger settings. Only up to 4 Destinations can be configured per logger. To add additional destination fields, change the Destination count field within the Enhanced settings tab of the Data logger settings window.
Subdirectory: Define the name of the folder that will contain the data in the Storage Destination (optional)
Filename extension: Extension for the data file. The default extension is dat (per UDBF File format). The other extension option is csv (for CSV File format) but this format is limited to a logging rate of 100Hz.
File Format: Choose either UDBF (binary format – Gantner proprietary) or CSV (configurable ASCII format)
5.3.2 CSV Header Settings
If you select CSV for File format, activate the Add header option to access additional CSV header settings. Make sure to also change the Filename extension to csv if using the CSV File format.
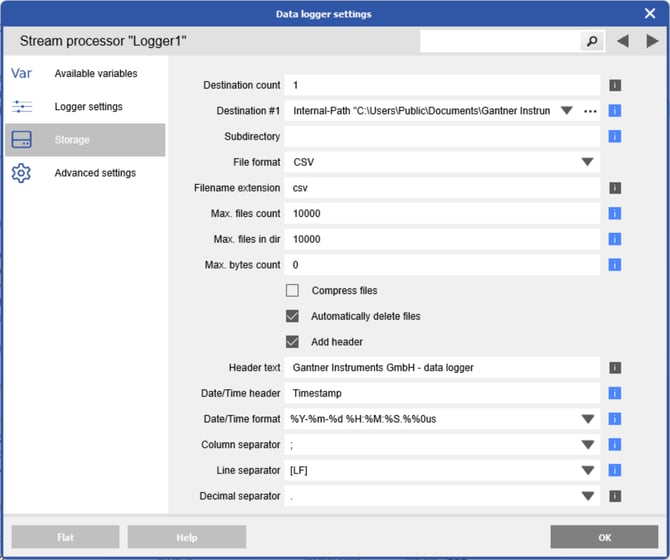
Click on the “i” icons for more information. For regular use, configure the following fields, as shown above:
Header text: Enter the desired text for the CSV header (optional)
Date/Time header: Optional date and time to be included in the header text (“Date;Time”)
Date/Time format: Format of the data and time column
Example: %Y-%m-%d[TAB]%H:%M:%S; à Column A: 2020-01-10 Column B: 10:16:00;
Column separator: Choose either [TAB] (tabulator), ; (semicolon) or , (comma)
Line separator: Choose either [CR] (Carriage return), [LF] (Linefeed) or both ([CR][LF] or [LF][CR])
Decimal separator: Choose either . (period) or , (comma)
5.3.3 Controller Level Logger Storage Destinations
5.4 Enhanced Settings
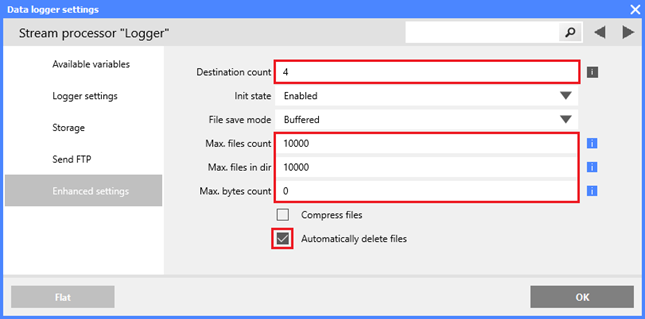
Click on the “i” icons for more information. For regular use, configure the following fields, as shown above:
Destination count: The number of storage destinations for the logger (max. 4 per logger).
Max. files count: The maximum number of files to be created by the logger (0 = Disabled).
Max. files in dir: The maximum files that can exist in a directory created by this logger (0 = Disabled).
Max. bytes count: The maximum number of bytes (disk space) this logger can save files to (0 = Disabled).
Automatically delete files: Deletes the oldest files when the Max. files count, Max. files in dir(ectory), or Max. bytes count has been reached.
5.5 PC Level Logger Management
- In the Data Acquisition tab, you can click Logger in the toolbar if a project level logger exists. If no data loggers exist in the project, create one back in the project settings tab.
- If a logger already exists on the PC level, you can select which logger to control from the drop-down list. Click to manually stop/start the logger.

- Open the Cockpit to see an overview of any project or controller level loggers. You can manually enable/disable them, add tags, and see the status including file progress.
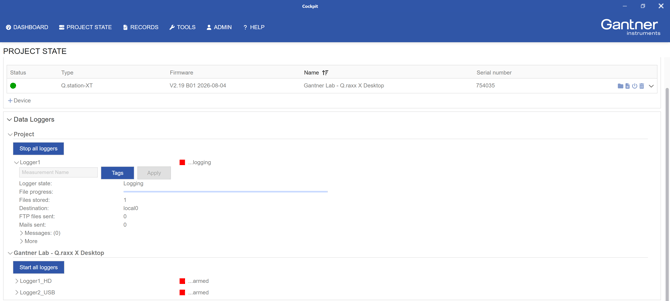
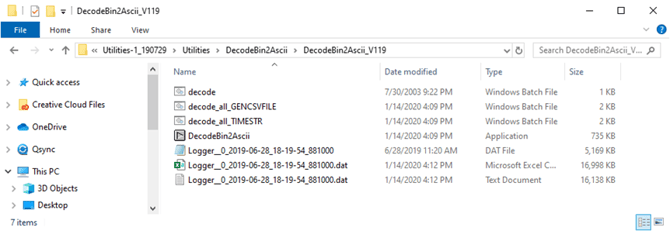
- The logger generates and saves either .dat or .csv files, per the logger’s configurations, to the specified directory, following naming scheme: [Recorder Name]_[Date]_[Time].[file extension]

- The .dat file extension is Gantner’s proprietary lightweight file format and can be viewed using the Gantner program viewer or converted to Ascii or CSV format using Gantner’s DecodeBin2Ascii tool. Both of these programs are available for free download on the Gantner Instruments website.
6. Data Visualization
In addition to configuration and data logging, GI.bench offers data visualization and custom dashboards.
6.1 Define Data Streams
Data visualization occurs on the PC level and requires the use of data streams. You must create a System stream for each controller buffer containing the desired data. You may also combine synchronous data collected at various sample rates (i.e., from different system streams) into a Merged stream at one rate.
Refer to Sections 4.1 and 4.2 of this guide for information regarding the creation and configuration of System data streams and Merged data streams.
6.2 View Online Measurement Values
In the Data Acquisition tab, go to Channels in the toolbar to view all variables. Click Acquisition to start live data if it hasn't already.
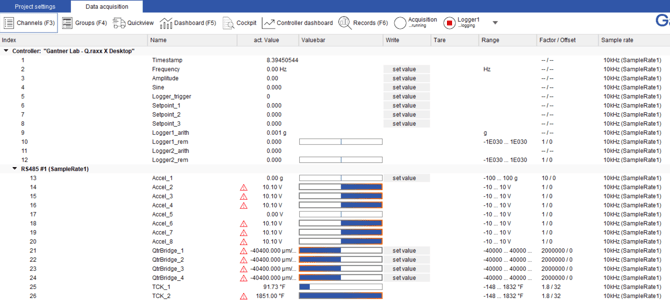
6.2.1 Edit Channel Groups
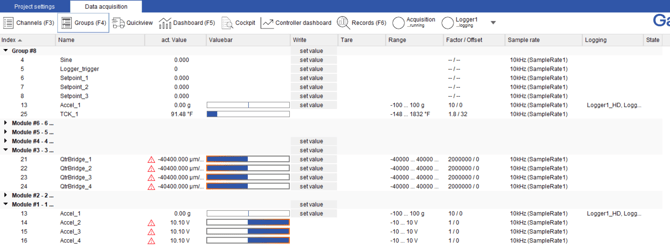
Channel groups can be created in GI.bench to organize a project further. You may create custom groups to contain select variables of a project, or automatically group variables from each I/O module. You may then view the online measurement values of all channel groups by going to the Groups (F4) view in the toolbar.
- Click on Channel groups in the lower-left control panel to open the Edit channel groups
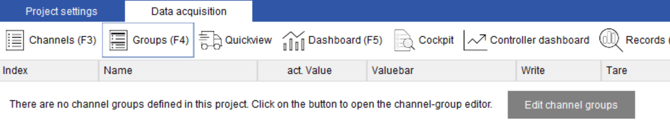
If a group already exists, to add more, right-click anywhere > Edit > Edit channel groups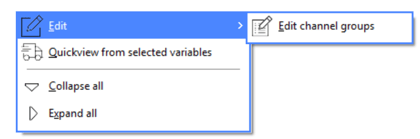
- In the Edit channel groups window, click the + icon to create a channel group or select an existing group from the drop-down menu and click the – icon to delete that channel group.
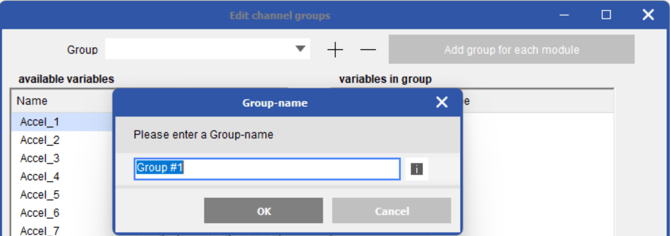
- You may click the Add group for each module button to quickly create groups for each module.
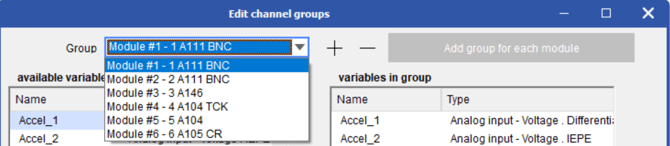
- To add variables to a group, select the group from the drop-down menu, then select the variable(s) you want to add to the group from the Available variables To select multiple variables at once, hold the Ctrl key when clicking. With the variable(s) selected, click the single arrow icon pointing to the right to add the variables to the group. To remove variables from a group, select the variable(s) you want to remove within the Variables in group list, then click the left arrow icon to remove.
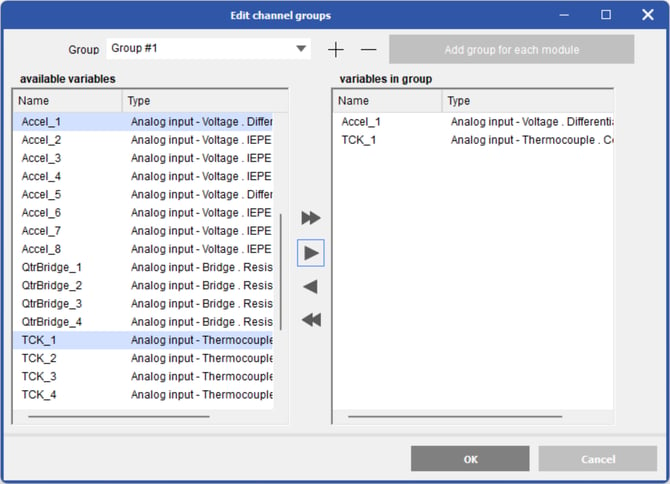
- You may use the double right or left arrow icons to either add all available variables or remove all variables from a channel group. Click OK to save changes.
- In the Data Acquisition tab, go to the Groups to view the online measurement values of all channel groups. Click the + or – next to a channel group to expand or collapse the variable tree.
6.3 View Online Graphics and Charts
6.3.1 Dashboards
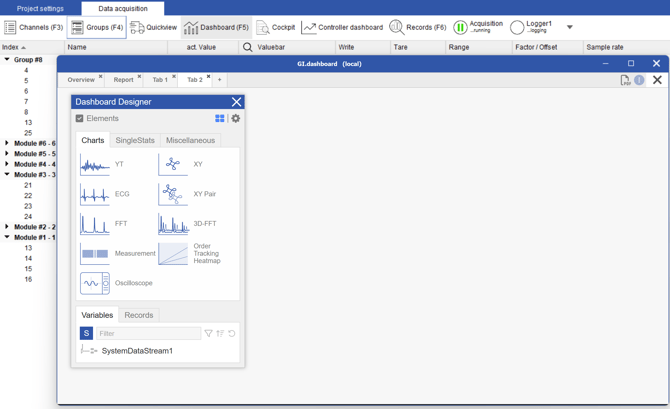
- In the Data Acquisition tab, go to Dashboard to view and make changes to your Dashboard(s). Once on the Dashboard, you will see the Dashboard Designer menu.
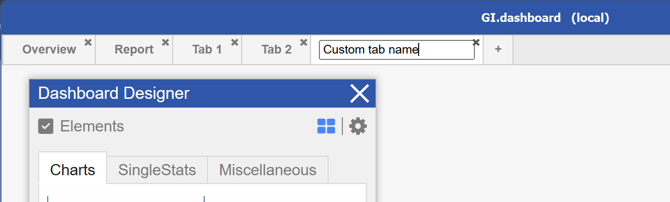
- Only 1 dashboard tab (Tab 1) exists by default, but infinite dashboard tabs can be added. Create additional tabs by clicking on the tab with the + Double-click on a tab to edit its name.
- In the Element Selection section of the Dashboard Designer, there are visualization elements available to choose. Click an element in the Dashboard Designer to add it to the dashboard.
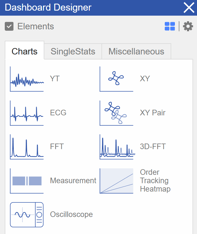
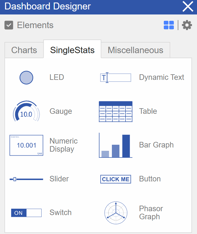
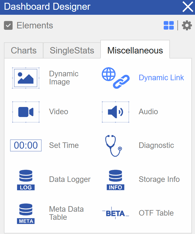
- Expand the desired folder in the Variables section of the Dashboard designer and use the drag and drop method to populate the element(s) with variables. Click on any variable in an element key to edit the Visibility, Display type, Line type, Line thickness, and Line color of that variable.
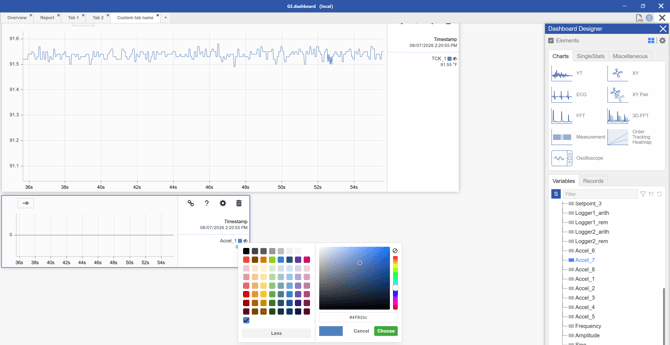
- You may also reposition any element on the dashboard by dragging it to the desired location. Resize an element by dragging the double-sided arrows at the bottom-corners of the element.
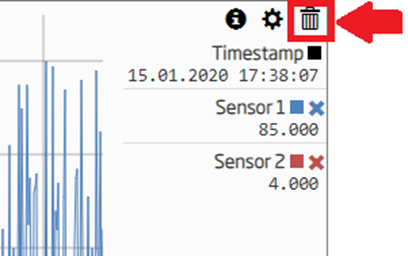
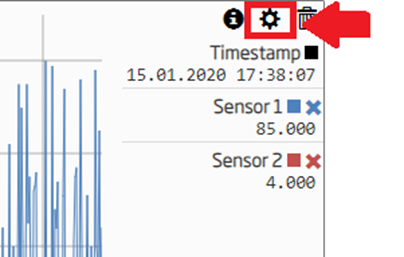
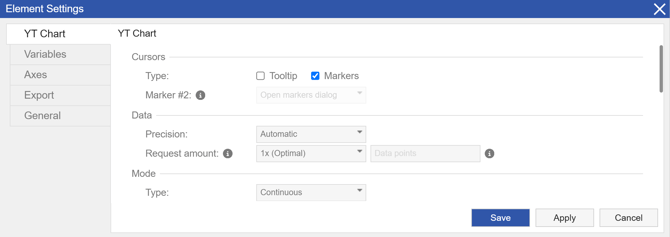
- To delete an element from the dashboard, click on the Trash icon at the top-right of the element. You may also click on the Gear icon for each element to bring up its respective settings menu.
- After completing any changes to the Chart Settings menu, click Apply and Save.
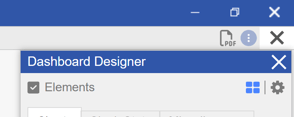
- Click on the X button above the Dashboard Designer to close it and lock all elements in place. You may still freely switch between dashboard tabs after the Dashboard Designer has been closed. You can open the Dashboard Designer by clicking on the 3 parallel lines next to Tab 1.
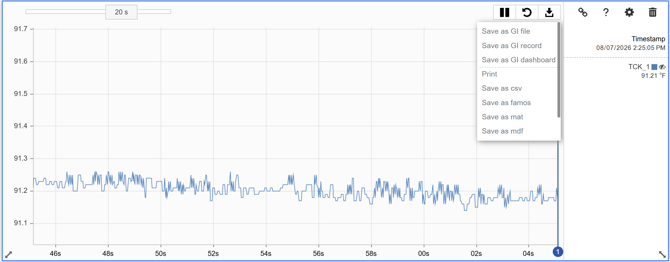
- With the dashboard elements locked in place, you may hover your mouse over an element and click the (“More Options”) button to Print the data or Save as JPEG, PNG, CSV, or UDBF.
6.3.2 Personalized Dashboards
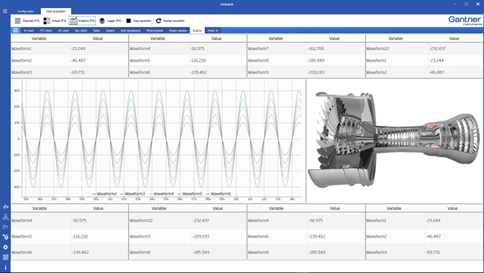
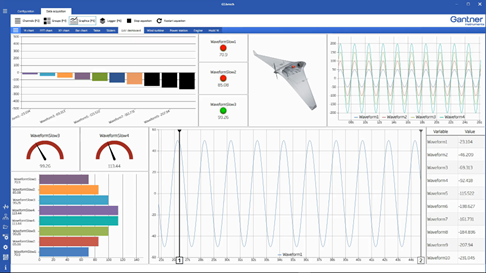
You can include images in your dashboard(s) for a more personalized effect.
- You must first place the desired images in the following directory on your PC. Always make sure to use the latest version of GI.bench, available for free download on Gantner Instruments’ website.
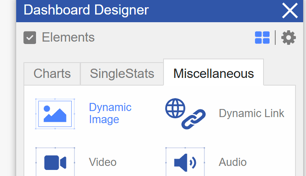
- In the Element Selection section of the Dashboard Designer, go to the Miscellaneous tab and select the Dynamic Image element. Drag and drop the element on your dashboard as desired.
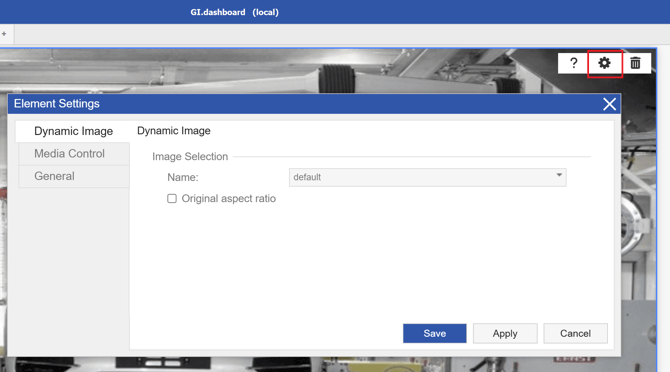
- With the Dynamic Image element on your dashboard, click the Gear icon to access its settings.
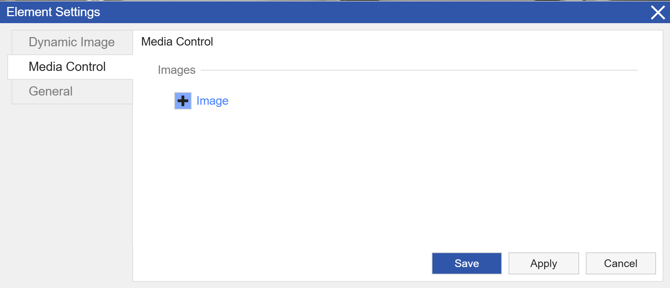
- Click the + button to select a new picture and click OK.
6.3.3 Dashboard Access
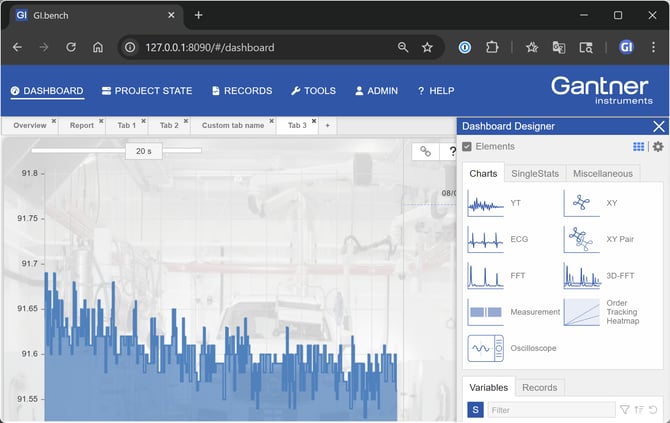
GI.bench project dashboard is accessible in a browser page using either [localhost IP]:8090 e.g. 127.0.0.1:8090 or controller dashboard at [IP of controller]:8090 e.g. 192.168.1.20:8090. Devices on the same network as the Q.station can access this as well e.g. tablets and smartphones.
Right-clicking the GI icon in the taskbar and selecting Cockpit opens the project dashboard in the default web browser.
International Sales and Technical Support
To find the contact information for your domestic Gantner Instruments Sales and Service location or the Gantner Instruments corporate headquarters, please visit https://www.gantner-instruments.com/support-downloads/technical-support/.
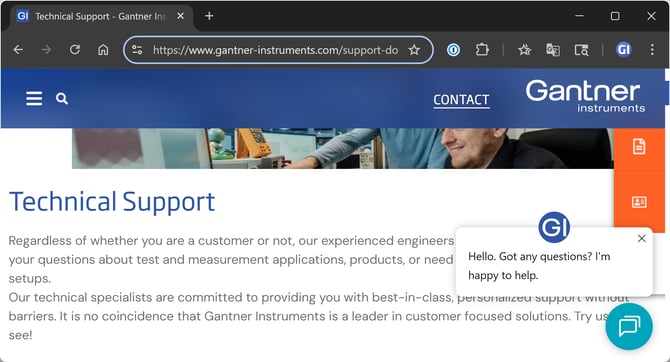
Here you can submit a ticket or find the contact information for the technical support representative in your region.
You can also find additional technical information at the Gantner Instruments Knowledgebase at https://knowledge.gantner-instruments.com/.
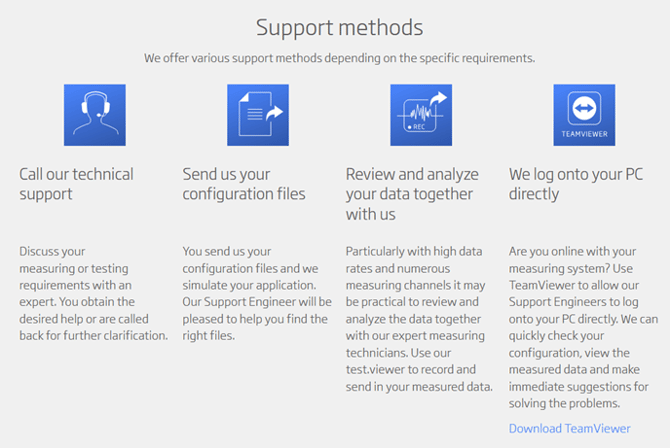
Gantner Instruments’ technical specialists are committed to providing best-in-class, individualized support. Technical support is free of cost and available without barriers to existing and potential customers.