GI.bench can display recorded data from the data logger directly in the dashboard, providing a clear historical overview of all signals at a glance.
Displaying recorded data is only supported when the data is stored in the native UDBF file format with the .dat file extension.
-
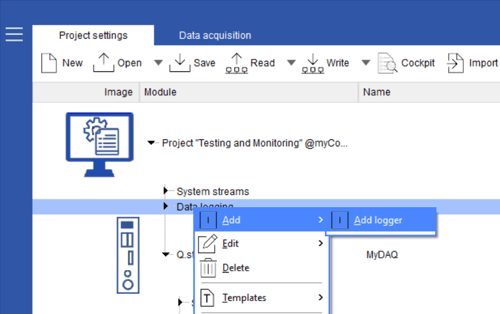
Create and configure a data logger in GI.bench to store data on the PC, and assign it a clear, unique name for easy identification. By default, logger files are saved to
C:\Users\Public\Documents\Gantner Instruments\GI.bench\data\records, which is the preferred storage directory.If required, you can specify a subdirectory in the logger’s Storage tab.
-
Start data acquisition and open a dashboard. To visualize the recorded data, select a chart type (for example, Yt or XY) and drag it onto the dashboard.
-
In the Dashboard Designer window, select the Records tab. This tab displays all data loggers that are currently recording or that have recorded data to a file.

-
Under each logger, all variables associated with that data logger are listed and can be dragged and dropped into a chart for post-processing and analysis.

-
Using the chart functions, you can zoom into a specific time range or select a predefined range using the date and time picker buttons.

-
Using the chart’s export function, data from the selected time range can be saved in multiple formats for file storage or reporting.

-
To refresh the chart with the latest data recorded to file, click the Reset button.

💡Tip
Use the chart linking functionality to connect an XY chart to a Yt chart. When you zoom into a specific time range on the Yt chart, the corresponding time period is automatically displayed in the XY chart.